*Please prepare a license ID and password for the license administrator.
*It is different from the service for JMAG WEB MEMBER (free membership). Please be careful.
Overview
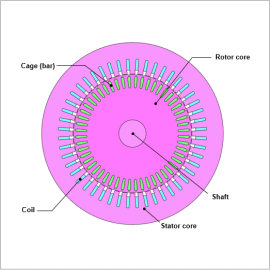
With advances in variable speed operation technology for induction motors, progress is being made in applications to fields where wide operating regions are required. With this, polyphase design may be used for the purpose of enhancing redundancy. Polyphase design includes the likes of six-phase drive using two inverters. Efficiency maps are created for both motor design and control design in order to fully comprehend the characteristics of these motors that are capable of drive within such a wide range.
It is necessary that operating region rotation speed and each loss point results are obtained as so to draw efficiency maps with actual measurements and calculators. This means that a large amount of calculations and time to organize the results are required. In concept design, evaluating efficiency maps within short amounts of time is also required. In JMAG-Designer, however, efficiency maps that account for the effect of iron loss and nonlinear magnetization characteristics can be created with ease.
In this example, a six-phase induction motor efficiency map is created in the concept design stage, and each operating point slip and iron loss are evaluated.
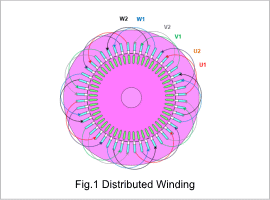
Stator Winding
Efficiency Map, Slip Map
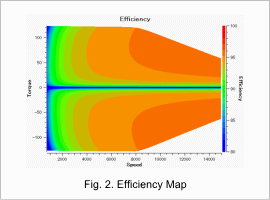
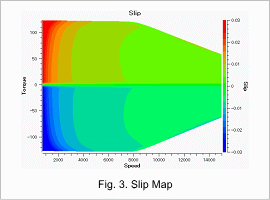
The efficiency map is displayed in Fig. 2, and the slip map is displayed in Fig. 3.
Efficiency can be understood from Fig. 2.
Slip can be understood from Fig. 3. Slip with maximum efficiency at each operating point can also be understood.
Loss Ratios at Each Operating Point
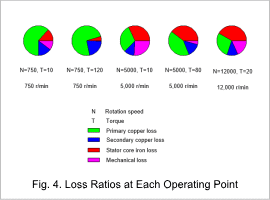
Fig. 4 displays pie charts showing loss ratios at low speed and low load, low speed and high load, medium speed and low load, medium speed and high load, and lastly, high speed and low load.
It is understood that iron loss dominates more than copper loss during high rotation speed.
It is understood that iron loss dominates more than copper loss during high rotation speed.


