Overview
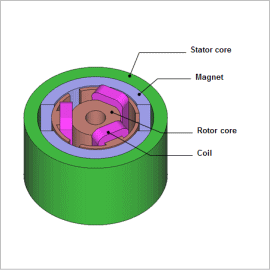
Magnetic analysis using the finite element method (FEM) is useful at the design stage because it can consider all electromagnetic behavior and motor geometry, and therefore makes estimation of the distribution and total amount of iron loss possible.
This note presents how to obtain the iron loss in the stator core and rotor core of a brush motor.
Magnetic Flux Density Distribution
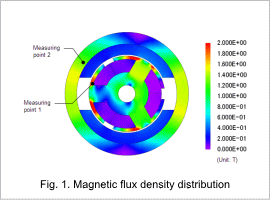
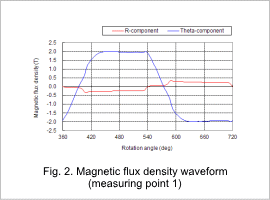
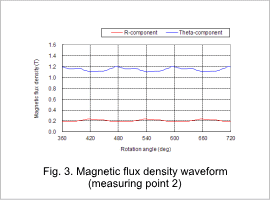
The magnetic flux density distribution is shown in fig. 1, the r-component and theta component of the magnetic flux density waveform for measuring point 1 are shown in fig. 2, and the r-component and theta component of the magnetic flux density waveform for measuring point 2 are shown in fig. 3.
The magnetic flux density of the rotor core is greater than that of the stator core, as indicated in fig. 1. Figures 2 and 3 show that the amount of variation in the magnetic flux density at measuring point 1 is large, while the amount of variation in the magnetic flux density at measuring point 2 is small. This difference in the amount of variation has an effect on the iron loss.
Joule Loss Density Distribution/Hysteresis Loss Density Distribution/Iron Loss Density Distribution
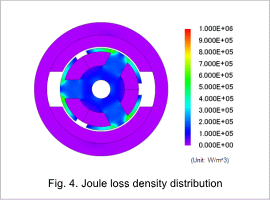
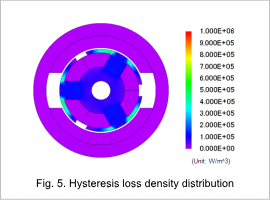
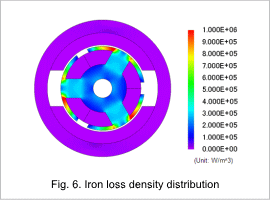
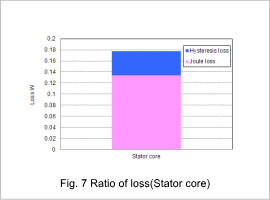
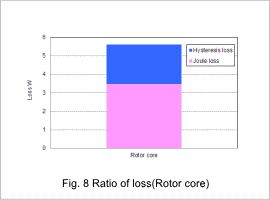
The joule loss density distribution is shown in fig. 4, the hysteresis loss density distribution is shown in fig. 5, and the iron loss density distribution is shown in fig. 6. The proportions of the loss in the stator core and the rotor core are shown in fig. 7 and fig. 8.
The joule loss density is greater in areas that have larger variations in magnetic flux density compared to areas with smaller variations in magnetic flux density, as confirmed by the magnetic flux density waveform. The same trend can be seen with the hysteresis loss. Fig. 7 and fig. 8 confirms that the rotor core accounts for a greater proportion of the joule loss and hysteresis loss.
