*Please prepare a license ID and password for the license administrator.
*It is different from the service for JMAG WEB MEMBER (free membership). Please be careful.
Overview
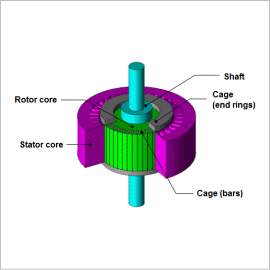
An induction motor is a motor in which the rotating magnetic field of the stator coils causes induced current to flow in an auxiliary conductor, which exerts force on the rotor in the rotational direction and causes it to spin. Induction motors are widely used in everything from industrial machines to home appliances because they have a simple construction and are small, light, affordable, and maintenance-free.
It is possible to drive an induction motor so that its slip is constant by adjusting the voltage or current against load variations. When this happens, each characteristic changes with influence from magnetic saturation and leakage flux because of the excitation variations in a specific slip.
This Application Note explains how to obtain the torque characteristics in an induction motor when the current amplitude has been changed in a specific slip.
Torque-Current Curve / Current-Voltage Curve
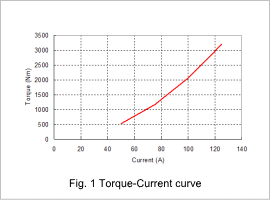
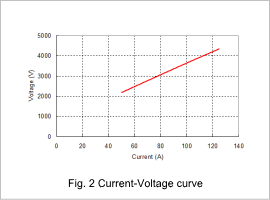
The Torque-Current curve and Current-Voltage curve when the current has been changed with a constant slip are shown in figures 1 and 2.
The figures show that the torque and voltage both rise when the current increases.
Eddy Current Density Distribution
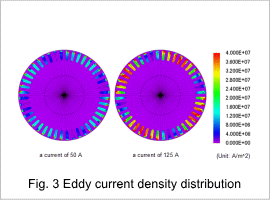
The eddy current density when the current has been changed with a constant slip is shown in fig. 3.
The figure shows that the eddy currents in the cage increase when the current value rises.
The figure shows that the eddy currents in the cage increase when the current value rises.
Joule Loss Density Distribution / Hysteresis Loss Density Distribution
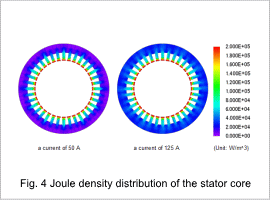
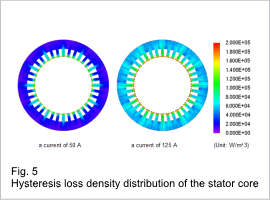
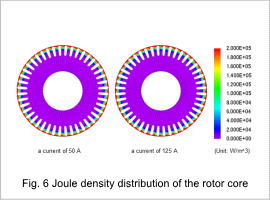
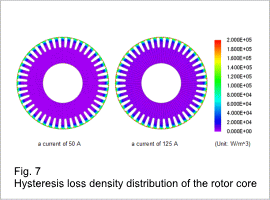
The joule loss density distribution and hysteresis loss distribution in the stator core when the current has been changed with a constant slip are shown in figures 4 and 5, and the joule loss density distribution and hysteresis loss density distribution in the rotor core are shown in figures 6 and 7.
The figures show that all of the losses increase when the current value rises.
