*Please prepare a license ID and password for the license administrator.
*It is different from the service for JMAG WEB MEMBER (free membership). Please be careful.
Overview
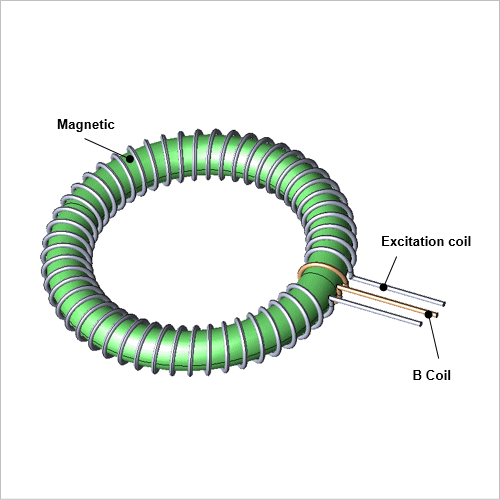
Magnetic properties affect the performance of products composed of magnetic circuits using magnetic material. This requires that the magnetic properties are assessed accurately. The H-coil method and excitation current method can be used to measure magnetic properties of magnetic material. The excitation current method will be used in this Application Note.
An excitation coil is wrapped around a ring test piece and a current is run through it. Doing this generates a magnetic field inside the excitation coil, and magnetic flux flows though the test piece placed inside the coil. Output voltage will be measured in the B coil wrapped around the ring test piece. Magnetic flux is obtained from the output voltage waveform, and then magnetic flux density is calculated from a cross section of the target. When the excitation current frequency used in the measurement is high, eddy current is generated in the magnetic material, so effects also appear in the waveform of the measured magnetic properties.
In this example, an analysis model is created based on the excitation current method, and the differences in magnetic properties obtained when the frequency is changed are shown.
Relationship between Frequency and Magnetic Properties (B-H Curve)
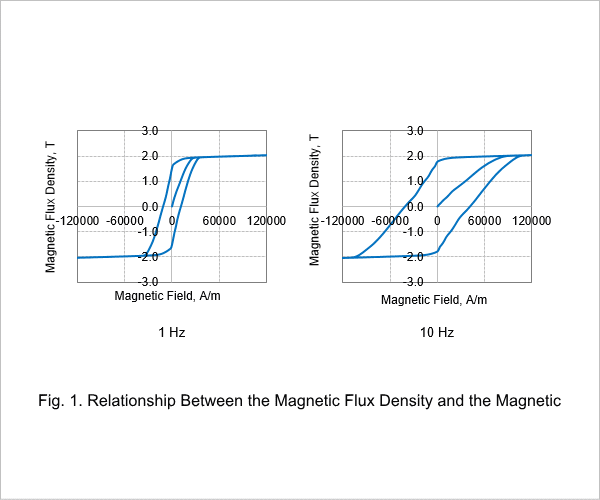
The relationship between the average magnetic flux density and magnetic field of the magnetic materials obtained when changing the frequency of the alternating current passed through the excitation coil to 1Hz and 10Hz is shown in Fig. 1 (B-H curve), respectively. When eddy current is generated, responsiveness is lowered in the measured average magnetic flux density due to eddy current, and a hysteresis loop is drawn.
Current Waveform Flowing Through Excitation Coil
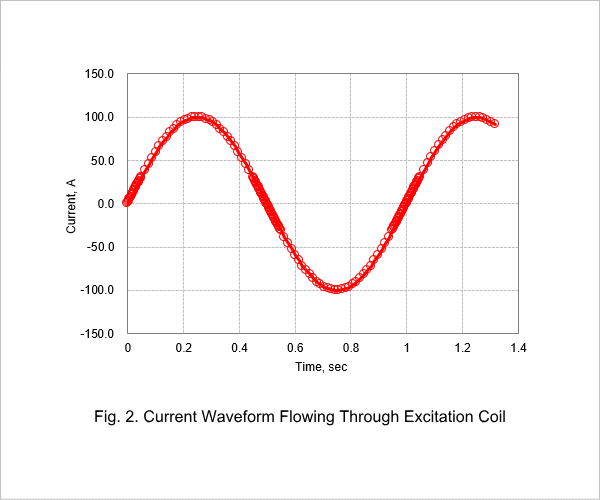
The current waveform passing through the excitation coil is shown in Fig. 2. In order to clearly show the areas with volatile changes in magnetic flux in the graph, time intervals where the current alternates between positive and negative are shortened.
Magnetic Waveform Produced by B Coil
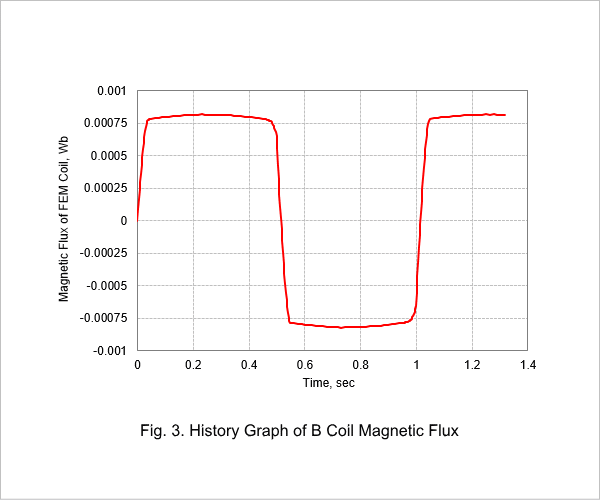
The history graph of the B coil magnetic flux when the excitation current frequency is 1Hz is shown in Fig. 3.
Magnetic Flux Density Distribution Contour Plot
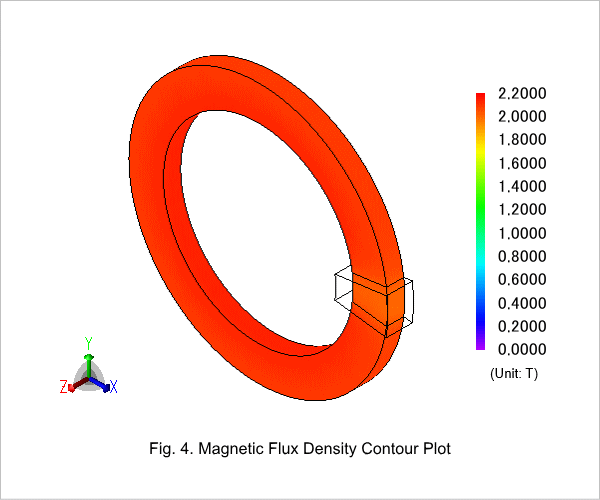
Magnetic flux density contour plot is shown in Fig. 4. Generated magnetic flux is nearly constant.
Eddy Current Density Contour Plot
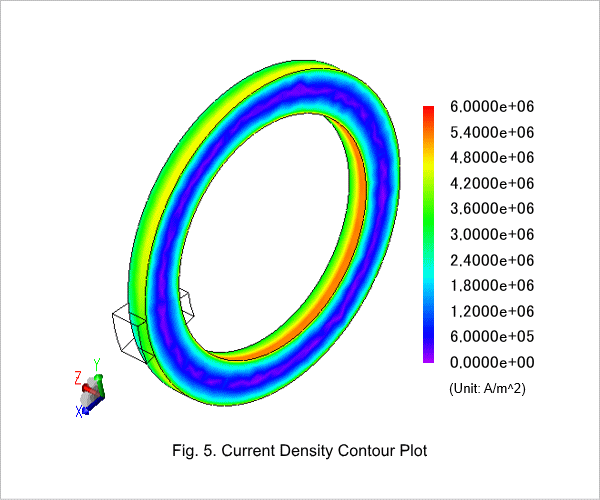
Current density contour plot is shown in Fig. 5. Eddy currents concentrate on the outside perimeter of the magnetic material due to the skin effect.

