*Please prepare a license ID and password for the license administrator.
*It is different from the service for JMAG WEB MEMBER (free membership). Please be careful.
Overview
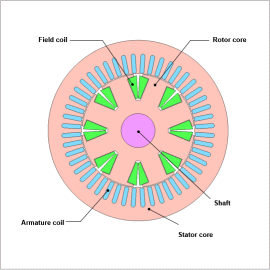
Wound-field synchronous motors are gaining attention as traction motors for electric vehicles that require a wide drive range because the field can be strengthened or weakened simply by adjusting the current. In motor design and control design, efficiency maps are created to understand the characteristics of motors that are driven over a wide range.
A wound-field synchronous motor has many different combinations of currents to obtain the same torque, and from within those combinations, the most efficient (lowest loss) combinations must be found.
When using FEA, you can account for detailed geometry and also run calculations for multiple operating points at the same time. You can obtain efficiency maps easily by also automating the results processing.
In this example, efficiency maps for a wound-field synchronous motor are created to check the combinations of currents that result in maximum efficiency. In addition, the loss breakdowns are also evaluated for the representative operating points.
Efficiency Map
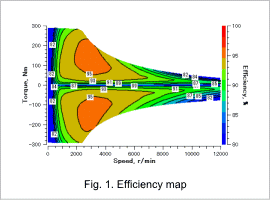
Fig. 1 shows the efficiency map.
It can be seen that for this motor, the maximum torque is 280 Nm, the maximum rotation speed is 12,000 rpm, and the maximum efficiency is 95 %.
It can be seen that for this motor, the maximum torque is 280 Nm, the maximum rotation speed is 12,000 rpm, and the maximum efficiency is 95 %.
Loss and Current Maps
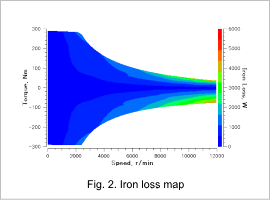
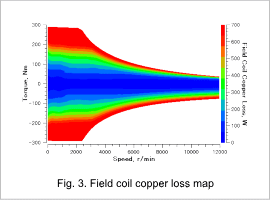
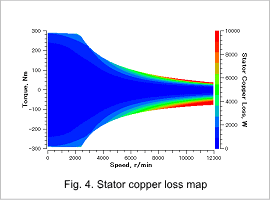
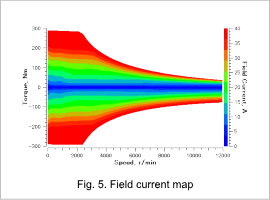
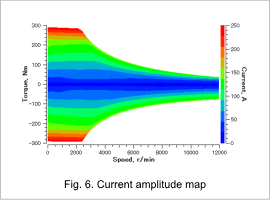
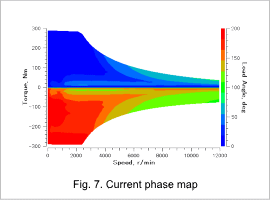
Fig. 2 shows the iron loss map, Fig. 3 shows the field coil copper loss map, Fig. 4 shows the stator copper loss map, Fig. 5 shows the field current map, Field. 6 shows the current amplitude map, and Fig. 7 shows the current phase map.
Loss Breakdowns at Each Operating Point
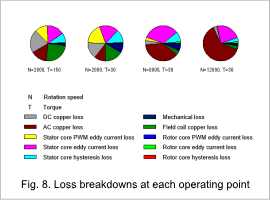
Fig. 8 displays pie charts showing the loss breakdowns at low speed and high load (2,000 r/min, 150 Nm), low speed and medium load (2,000 r/min, 30 Nm), medium speed and medium load (8,000 r/min, 30 Nm), and lastly, high speed and medium load (12,000 r/min, 30 Nm).
The DC copper loss breakdown for the stator core is large at low speed and high load. The AC copper loss breakdown for the stator core is large at medium speed and medium load, as well as high speed and medium load. Among the iron losses for the stator core, the eddy current loss in particular increases with rotation speed, but at 12,000 r/min, the AC copper loss is more dominant. On the contrary, it can be seen that the breakdown for the entirety of the rotor core loss is small.
The DC copper loss breakdown for the stator core is large at low speed and high load. The AC copper loss breakdown for the stator core is large at medium speed and medium load, as well as high speed and medium load. Among the iron losses for the stator core, the eddy current loss in particular increases with rotation speed, but at 12,000 r/min, the AC copper loss is more dominant. On the contrary, it can be seen that the breakdown for the entirety of the rotor core loss is small.


