Overview
SR motors operate using the nonlinear region of a magnetic steel sheet, so the inductance displays nonlinear behavior that distorts the excitation current waveform a great deal, making it impossible to carry out advanced projections that are accurate with calculation methods that follow linear formulas. Consequently, it becomes necessary to use the finite element method (FEM), which can handle nonlinear magnetic properties in material and minute geometry as well as transient currents.
This Application Note explains how to carry out a torque analysis that changes the switch conversion timing and evaluate both the torque ripples and average torque in an SR motor.
Torque Waveform
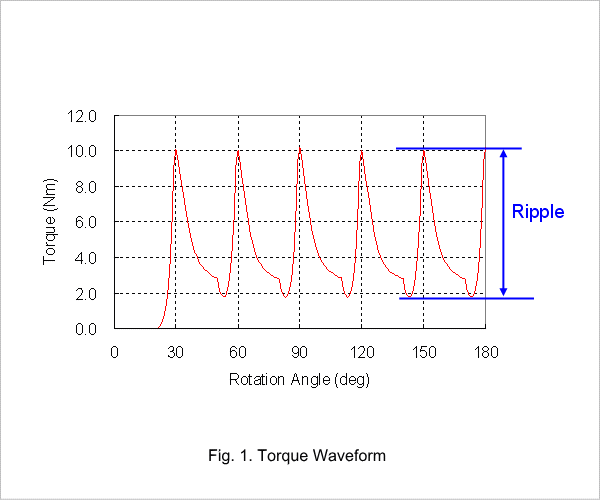
It is apparent that torque ripple peaks coincide with declines in torque that occur when the phase torque switches.
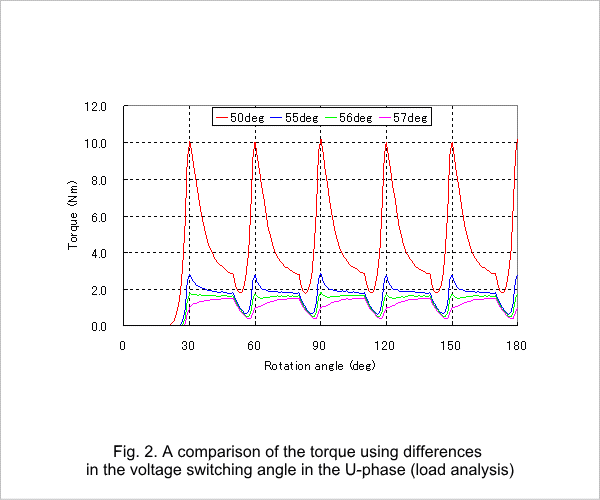
Torque Ripple Comparison
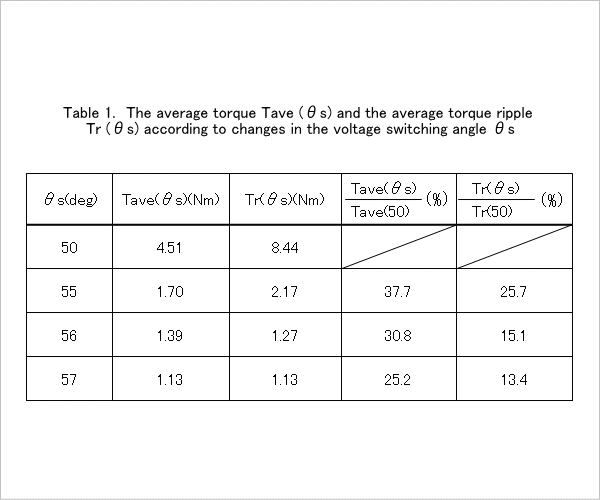
Fig. 2 shows a graph comparing a load analysis at voltage switching angles of 55, 56, and 57 deg in the U-phase with the torque waveform of a switching angle of 50 deg. A comparison of each of the average torques and the torque ripples at a voltage switching angle of 50 deg is listed in Table 1.
Fig. 2 shows that the switch timing can significantly reduce the torque ripple.
Comparing a 56 deg voltage switching angle with one of 50 deg, the torque ripple has been contained by approximately 20%, but at the same time there has been a decline in the average torque, so further studies are necessary in order to improve the torque ripple without allowing the average torque to decline, such as considering increases in the overlap of the torque in each phase by changing either the number of phases or the width of the salient poles.