*Please prepare a license ID and password for the license administrator.
*It is different from the service for JMAG WEB MEMBER (free membership). Please be careful.
Overview

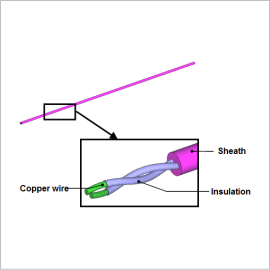
Twisted pair cables are used in situations that require strict noise reduction like with signal lines and speaker cables because they are not affected by external noise and do not emit much noise of their own. The cable’s performance relies on its electric properties, but these change depending on the state of the current that is flowing. For example, when the current frequency rises, the current is offset in the copper wires because of the skin effect and proximity effect. As a result, the apparent cross-sectional area of the current flow is reduced, causing the alternating current resistance to increase and the inductance to change. An increase in the resistance leads to an increase in losses, and changes in inductance result in distortions in the signal. This is why these frequency characteristics need to be understood in advance.
The above phenomena occur in the interior of the copper wires, so an evaluation using a magnetic field analysis based on the finite element method (FEM) is useful because they can be difficult to predict with manual calculations.
This Application Note explains how to obtain the frequency characteristics of the resistance and inductance in twisted pair cables.
Current Density Distribution

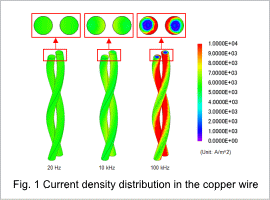
The current density distribution of the copper wire is shown in fig. 1. At a frequency of 10 kHz the proximity effect causes offsets in the current, and at 100 kHz both the skin and proximity effects cause offsets in the current. It is anticipated that these offsets in current have an effect on the resistance and inductance.
Resistance/Inductance Frequency Characteristics
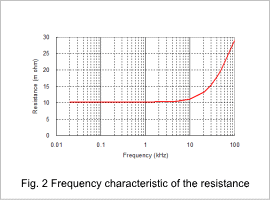
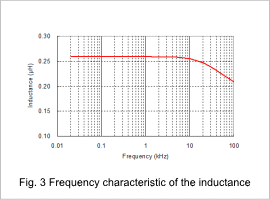
The frequency characteristic of the resistance in the copper wire is shown in fig. 2, and the frequency characteristic of the inductance is shown in fig. 3. The resistance and inductance begin to change gradually at around 10 kHz due to the proximity effect, and the skin effect begins to increase as the frequency grows larger, so both resistance and inductance change rapidly. In order to reduce the skin and proximity effects, the structure needs to be studied so that the current in the frequency range being used can flow through the conductor uniformly.


