Overview
Because a bus bar's geometry is complicated, it is difficult to predict in advance where there will be unevenness in the current's flow while current is running, and whether this will cause heat generation. With magnetic field analysis using the Finite Element Method (FEM), it is possible to correctly obtain the unevenness in current distribution and the joule loss, and then predict the temperature distribution with these as causes of heat generation.
This Application Note presents how to obtain the temperature distribution in a bus bar or the like with changes in the power supply frequency.
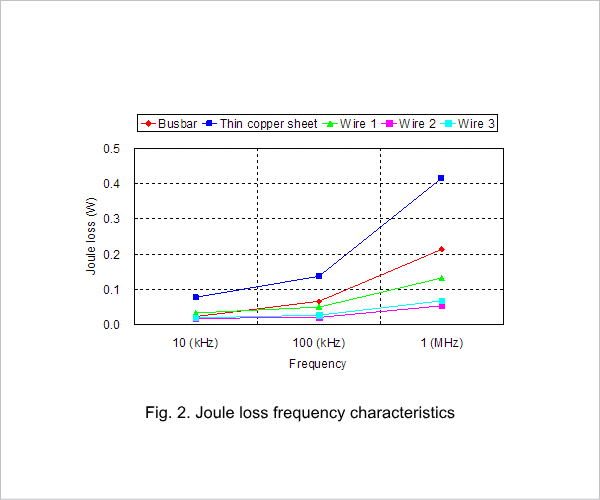
Current Density Distribution/Joule Loss Frequency Characteristics
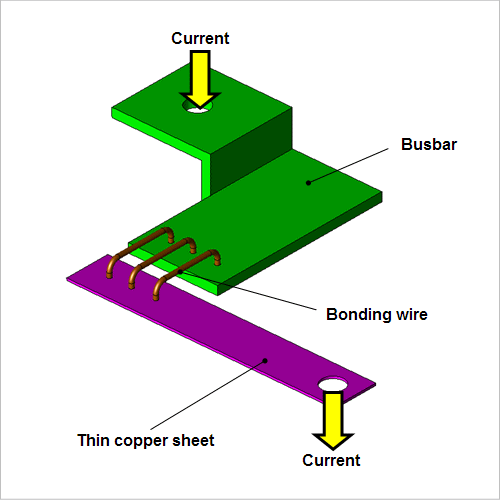
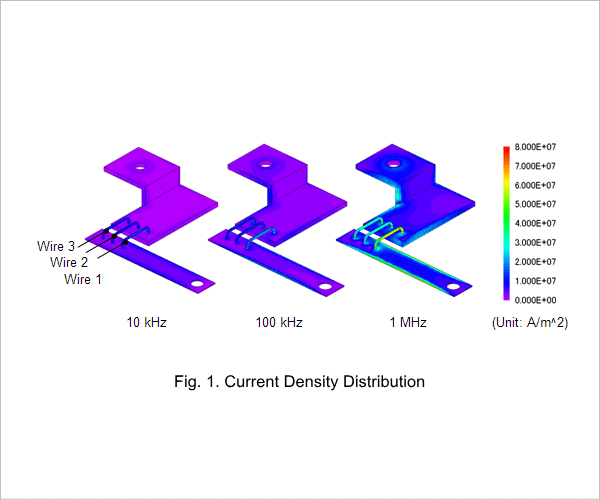
The current density distribution at each frequency is indicated in fig. 1, and the frequency characteristics of the joule loss are indicated in fig. 2. The current density in the bonding wires and the thin copper sheet increase as indicated in fig. 1. Joule loss increases as the frequency increases, as indicated in fig. 2. This is because the cross-sectional area where current is flowing decreases and the resistance increases due to the skin effect.
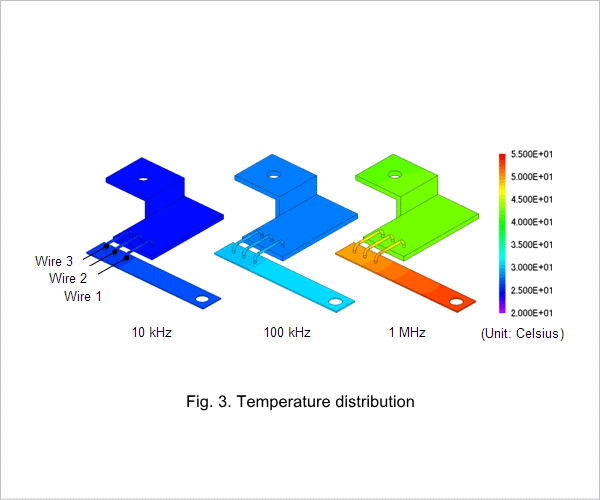
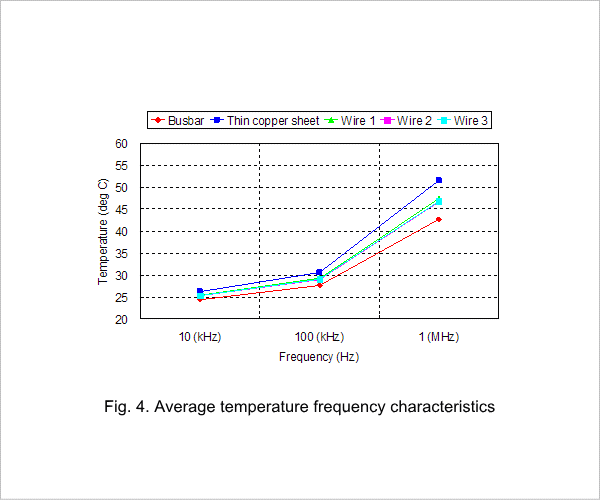
Temperature Distribution/Average Temperature Frequency Characteristics
The temperature distribution of the bus bar is indicated in fig. 3, and the frequency characteristics of the average temperature are indicated in fig. 4. The temperature increases in the bonding wires and thin copper sheet along with the current density at all of the frequencies. Also, the temperature increases drastically at 1 MHz compared to 10 kHz and 100 kHz. Caution needs to be taken because the increase in temperature can not only cause the bus bar to burn out, but can also damage the device as thermal stress increases.