*Please prepare a license ID and password for the license administrator.
*It is different from the service for JMAG WEB MEMBER (free membership). Please be careful.
Overview
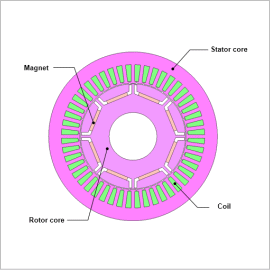
Since an IPM motor uses rare-earth sintered permanent magnets with strong magnetic force, and can use reluctance torque generated from the difference between the d-axis inductance and q-axis inductance in addition to magnet torque due to a magnetic field and rotating magnetic field, it has a large operating region and is a highly efficient motor.
Since the efficiency varies with the rotation speed and load, it is useful to create an efficiency map for motor design and control design. Creating an efficiency map requires an enormous amount of computations and it takes time to organize the results. Although it is possible to estimate efficiency by calculating the torque, voltage, and current from motor voltage equations and torque equations, it is difficult to estimate iron loss this way. Also, taking into account the effects from nonlinear magnetization characteristics of the motor core is difficult. This makes it difficult to calculate efficiency accurately. In JMAG-Designer, an efficiency map can be easily created taking into account the influence from iron loss and nonlinear magnetization characteristics.
In this example, an efficiency map of an IPM motor is created and the loss ratios at each operating point are evaluated.
Efficiency Map
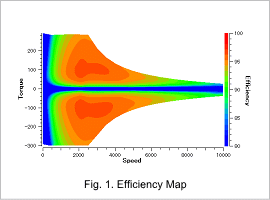
Fig. 1 shows the efficiency map.
From Fig. 1, the output torque and input torque efficiencies can be seen. It can be seen that in the high rotation speed half of the map that the efficiency is higher in the output torque area than in the input torque area.
From Fig. 1, the output torque and input torque efficiencies can be seen. It can be seen that in the high rotation speed half of the map that the efficiency is higher in the output torque area than in the input torque area.
Loss, Magnetic Flux, Power Factor Maps
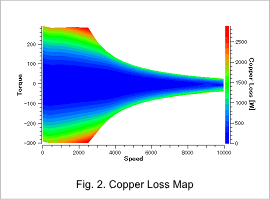
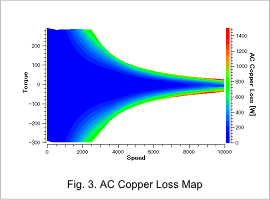
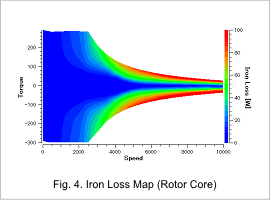
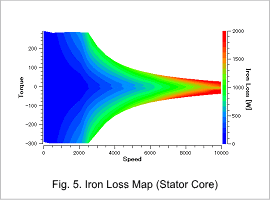
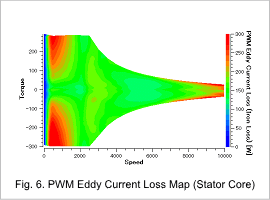
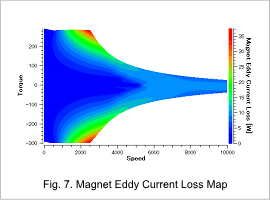
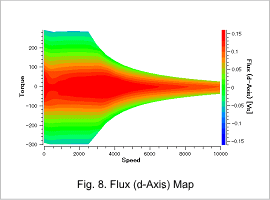
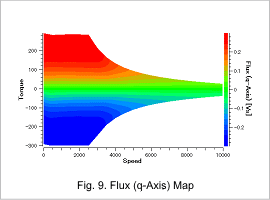
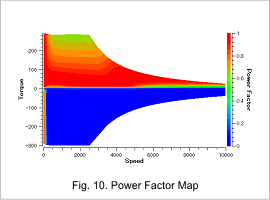
Iron loss, magnetic flux, and power factor maps are shown from Fig. 2 to Fig. 10.
Loss Ratios at Each Operating Point
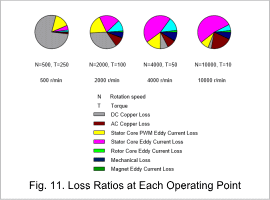
Fig. 11 displays pie charts showing loss ratios at low speed and high load, low speed and medium load, medium speed and medium load, and lastly, high speed and low load.
DC copper loss decreases in accordance with load. AC copper loss increases in accordance with speed and load. It can be seen that the loss of the stator core increases in accordance with rotation speed, with eddy current loss increasing in particular. Conversely, it can be confirmed that the entirety of loss of the rotor core is comparatively small.
DC copper loss decreases in accordance with load. AC copper loss increases in accordance with speed and load. It can be seen that the loss of the stator core increases in accordance with rotation speed, with eddy current loss increasing in particular. Conversely, it can be confirmed that the entirety of loss of the rotor core is comparatively small.


