Overview
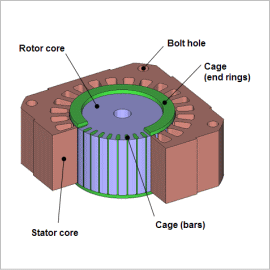
Induction motors are widely used in everything from industrial machines to home appliances because they have a simple construction without parts that experience wear from abrasion, and can be used simply by connecting them to a power source.
Improved efficiency in induction motors is an important theme. Iron loss, a cause of lower efficiency along with primary and secondary copper loss, must be reduced in order to improve efficiency. The relative importance of iron loss tends to grow especially with higher rotations due to the inverter drive, so it is helpful to estimate the complex iron loss distribution inside the core.
This Application Note presents an example of how to find the iron loss in the stator core and rotor core at a rotation speed of 3,300 r/min.
Magnetic Flux Density Distribution
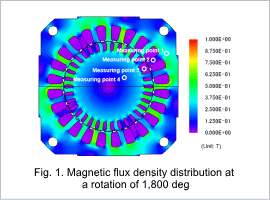
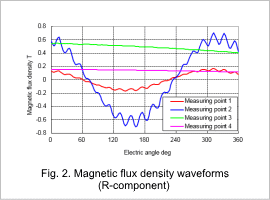
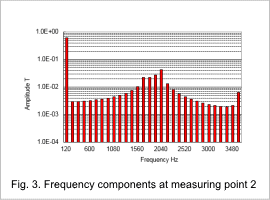
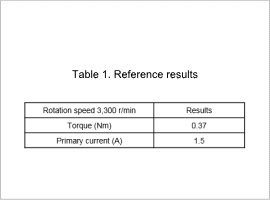
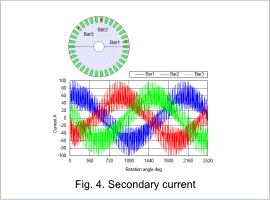
The magnetic flux density distribution of the stator core and rotor core is shown in fig. 1, the magnetic flux density waveforms of the magnetic flux density R-component at measuring points 1, 2, 3, and 4 are shown in fig. 2, and a graph of the results from measuring point 2 after FFT is shown in fig. 3. Also, the steady-state torque and primary current amplitude are shown in table 1, and the secondary current flowing in the cage is shown in fig. 4.
Comparing measuring points 1 and 2, at measuring point 2 the magnetic flux density has a large value and amount of variation, but at measuring point 1 the magnetic flux density has a small value and amount of variation. For measuring points 3 and 4, it can be confirmed that the value is large at measuring point 3. Further, when measuring points 2 and 3 are compared, the amount of variation is seen to be larger at measuring point 2. These differences in magnetic flux density have an effect on iron loss.
120 Hz, the frequency of the power supply, is dominant at measuring point 2, as seen in fig. 3.
The frequency of the secondary current affects the magnetic flux density on the rotor side.
Joule Loss Density Distribution/Hysteresis Loss Density Distribution/Iron Loss Density Distribution
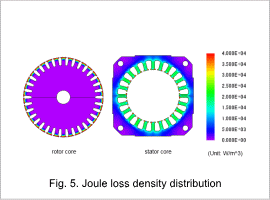
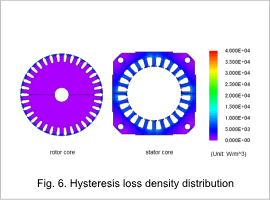
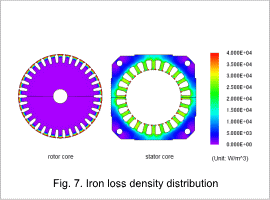
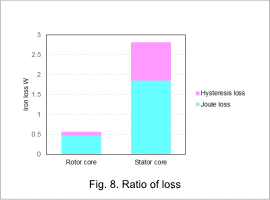
The joule loss density distributions for the stator core and rotor core are shown in fig. 5. The hysteresis loss density distributions for the stator core and rotor core are shown in fig. 6. The iron loss density distributions for the stator core and rotor core are shown in fig. 7. The ratios of loss for the stator core and rotor core are shown in fig. 8.
As shown in the magnetic flux density waveforms, joule losses are greater in places where the amount of variation in the magnetic flux density is large, compared to places where the amount of variation in the magnetic flux density is small. The same trend can be seen in the hysteresis losses as well, as shown in table 2 by the fact that the ratio of the joule and hysteresis losses taken up by the stator is large.
