*Please prepare a license ID and password for the license administrator.
*It is different from the service for JMAG WEB MEMBER (free membership). Please be careful.
Overview
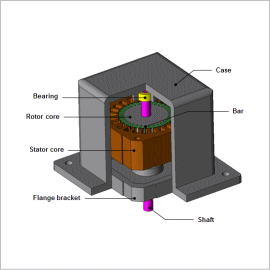
Because the construction of induction motors is simple, easy, durable, and highly effective, they have been widely used throughout industry in general for an extensive period of time. In recent years however, there has been an increase in words raised concerning issues of pollution and improvements to work environments, and the noise that emanates from induction motors is also becoming an issue. Electromagnetic force acting on the induction motor is the source that generates torque, but at the same time the excitation force of the motor itself generates electromagnetic noise.
To favourably evaluate both noise caused by electromagnetic force and vibrations, it is necessary to accurately grasp the electromagnetic force distribution acting on the stator core which is the source of radiated sound, and to obtain the eigenmode of the entire motor that includes the connected case. Because electromagnetic force distribution and eigenmode are dependent on the geometry of the stator core, it is necessary to obtain this via analyses such as the finite element method.
In this example, electromagnetic force generated in the induction motor stator core is obtained, and an example of evaluating sound pressure by linking it with the eigenmode of the motor is shown.
Eigenmode
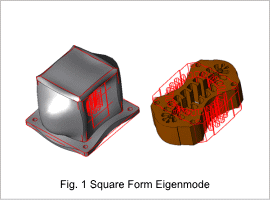
Attention is paid to the mode of vibration depending on the number of poles. Because a 4-pole model is being used, it is understood that this mode exists near 3,700 Hz by confirming the rectangular vibration mode. The confidition of deformities is shown in Fig. 1.
Acceleration at Each Frequency Generated by Electromagnetic Force
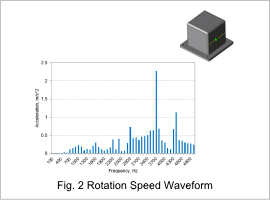
The frequency dependence of acceleration generated by electromagnetic force during rotation is displayed in Fig. 2. One side is chosen for evaluation points in the diagram for the case shown, maximum value is extracted from the effective value of each point and is taken as the evaluation value of that frequency. It is confirmed that acceleration is at maximum when near eigenmode at 3,700 Hz as shown in Fig. 1, and resonance is considered to occur also.
Acceleration and Sound Pressure Distribution in Square Form Eigenmode
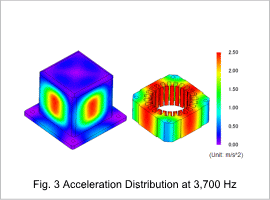
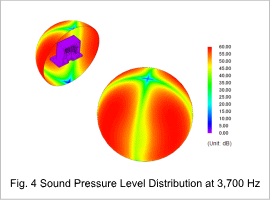
Acceleration at 3,700 Hz and sound pressure levels are each displayed in Fig. 3 and Fig. 4. It can be seen that both acceleration and sound pressure levels are high due to resonance. It can be additionally confirmed that eigenmode spatial characteristics are reflected in the distribution of both.
