*Please prepare a license ID and password for the license administrator.
*It is different from the service for JMAG WEB MEMBER (free membership). Please be careful.
Overview

In electrical device design, due to increasing demand, optimal design using trial and error is being studied. In recent years, topology optimization that can significantly change the geometry itself has been attempted, and novel designs heretofore not considered are being created.
By using FEA, it is possible to optimize a sensitivity analysis (density method) topology using the material density in the design region as a design variable. For relatively simple problems, from evaluating the influence (sensitivity) of design variables on objective functions such as for maximizing torque or minimizing loss it is possible to speed up convergence and achieve a topology optimization with a small number of cases.
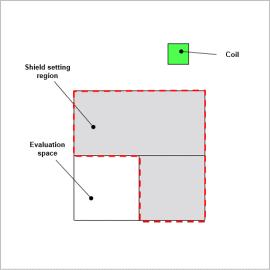
In this example, a case study in which the geometry of a magnetic shield is optimized using topology optimization that uses a sensitivity analysis (density method) is presented. Due to the material density distribution, topology changes, magnetic energy changes, and the optimal case magnetic flux lines can be checked.
Changes in Topology

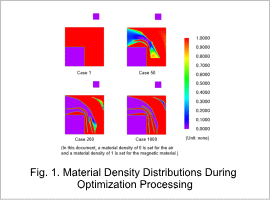
Fig. 1 shows the material density distribution (during changes in topology) during topology optimization calculation process.
As the optimization progresses, the geometry gradually gets determined, resulting in a multi-layer shield geometry from minimizing the magnetic energy in the evaluation region.
As the optimization progresses, the geometry gradually gets determined, resulting in a multi-layer shield geometry from minimizing the magnetic energy in the evaluation region.
Changes in Magnetic Energy During Optimization Processing

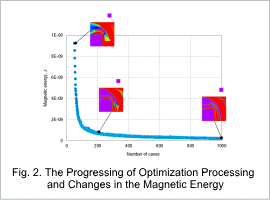
Fig. 2 shows the history of magnetic energy changes during the topology optimization.
From the air layer and the magnetic layer alternating going from the outermost layer to the innermost layer, it can be seen that the magnetic resistance increases and the magnetic energy decreases in the direction of the magnetic flux.
From the air layer and the magnetic layer alternating going from the outermost layer to the innermost layer, it can be seen that the magnetic resistance increases and the magnetic energy decreases in the direction of the magnetic flux.
Optimal Case Magnetic Flux Lines

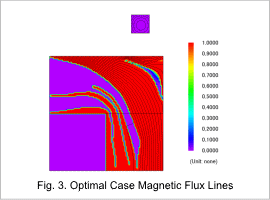
Fig. 3 shows the magnetic flux lines flowing in the shield design region for the optimal case.
It can be seen that the most of the magnetic flux flows along the shield. Also, it can be seen that the leakage magnetic flux has not entered the evaluation region due to the innermost layers.
It can be seen that the most of the magnetic flux flows along the shield. Also, it can be seen that the leakage magnetic flux has not entered the evaluation region due to the innermost layers.


