*Please prepare a license ID and password for the license administrator.
*It is different from the service for JMAG WEB MEMBER (free membership). Please be careful.
Overview
In the low speed side of an N-T curve, there is a region where the maximum torque is constant regardless of the rotation speed because of current limitations. In this region, the current phase that maximizes torque is selected. When designing motor components, many designs are compared using dimensions as design variables. In such situations, the current phase with maximum torque will differ depending on motor geometry. In order to obtain this, what is required is an evaluation of the phase with maximum torque per geometry in advance using FEA.
When comparing a large number of designs using simulations, torque characteristics can be evaluated by automatically searching for the current phase that provides the maximum torque.
In this example, a search is performed for the current phase that maximizes torque for each of 3 rotor geometries. Motor average currents and torque ripples are evaluated using the obtained current phases.
Evaluation Details
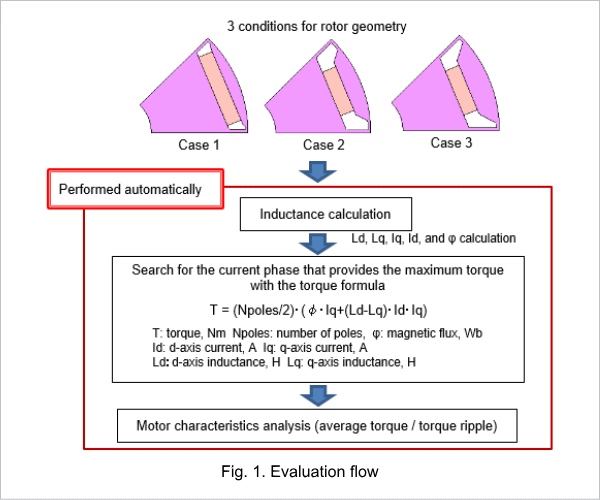
Inductance values are calculated at 10 deg increments in the current phase range of 0 to 60 deg calculated from 3 rotor geometry cases, obtaining values Ld, Lq, Id, Iq, and φ.
From inductance evaluation results, torque is obtained with torque formulas for each rotor geometry, and a search is performed for the current phase that obtains maximum torque. Motor torque analysis is performed with the obtained current phase, from which the average torque and ripple ratio are obtained. Fig. 1 shows the evaluation flow.
From inductance evaluation results, torque is obtained with torque formulas for each rotor geometry, and a search is performed for the current phase that obtains maximum torque. Motor torque analysis is performed with the obtained current phase, from which the average torque and ripple ratio are obtained. Fig. 1 shows the evaluation flow.
Current Phase - Torque Graph
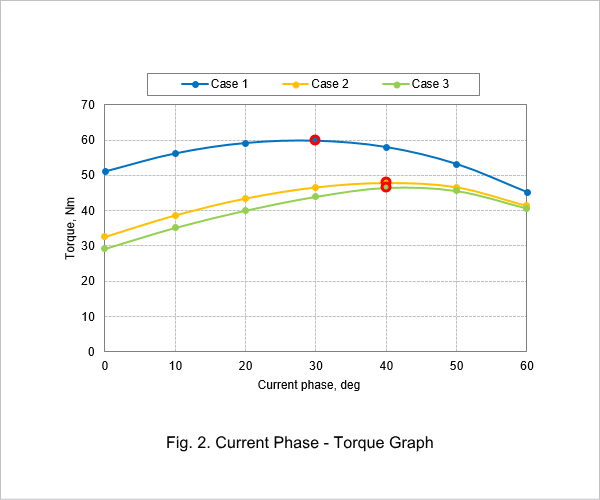
Fig. 2 shows the current phase - torque graph. From this, the current phase where the torque is maximum is found for each rotor geometry. The current phases for the maximum torque for cases 1 to 3 are shown in red.
Average Torque and Ripple Ratio
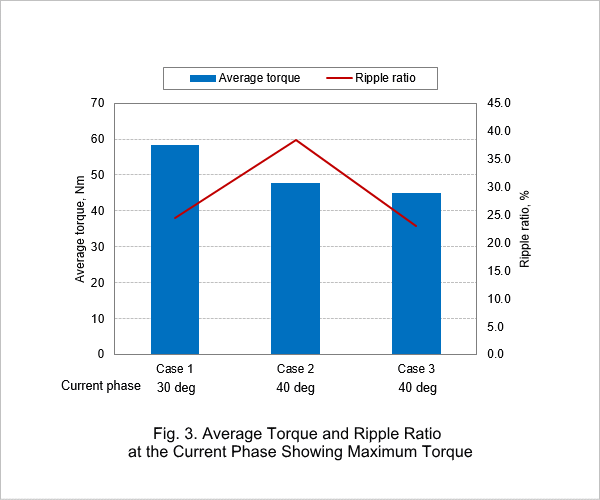
Fig. 3 shows the average torque and ripple ratio at the current phase for maximum torque.
These values are calculated from the current phase showing maximum torque obtained from the inductance shown in Fig. 2.
These values are calculated from the current phase showing maximum torque obtained from the inductance shown in Fig. 2.
Comparison Between Torque Values Obtained With the Torque Formula and FEA
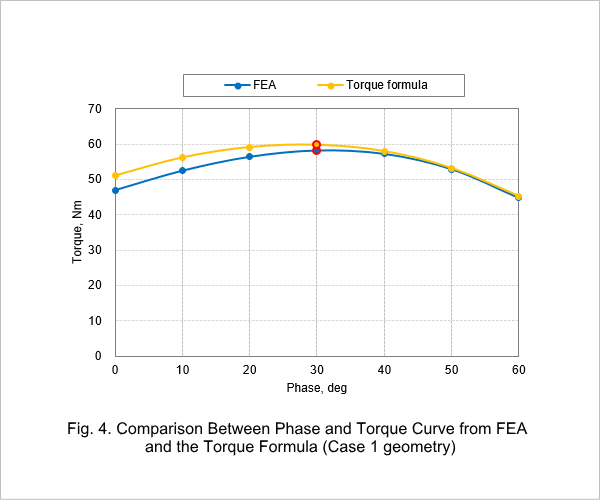
Fig. 4 shows the graph comparing the torque value obtained with the torque formula at each current phase for Case 1 geometry, and the average torque value obtained with FEA.
Because the torque value obtained with the torque formula is of a fixed inductance, the value is high when compared to the FEA results that account for the influence of magnetic saturation. In this model, torque shows the maximum at a current phase of 30 deg for both FEA and the value obtained from the torque formula, and it can be confirmed that current phase values match.
Because the torque value obtained with the torque formula is of a fixed inductance, the value is high when compared to the FEA results that account for the influence of magnetic saturation. In this model, torque shows the maximum at a current phase of 30 deg for both FEA and the value obtained from the torque formula, and it can be confirmed that current phase values match.

