Overview
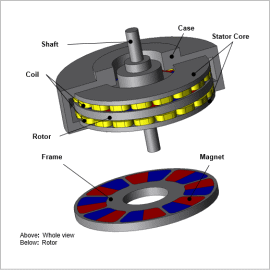
In order to evaluate noise/vibration caused by electromagnetic force, it is necessary to accurately obtain the source of sound radiation, the total eigen mode of the motor, including the cases it is linked to must be perceived and taken into account at the same time. It is effective to use the finite element method in simulations before creating a prototype to assess the level of vibration caused by air distribution from electromagnetic force and eigen mode.
In this example, phenomena confirmed in axial gap-type motors that occur at maximum sound pressure level, from an electromagnetic excitation force and eigen mode perspective.
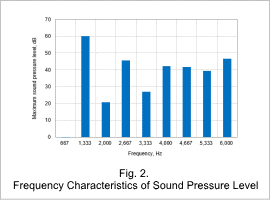
Frequency Characteristics of Maximum Sound Pressure Level
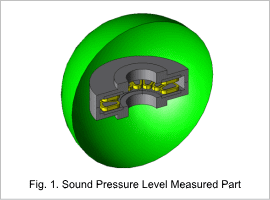
Sound pressure level target plane for stress evaluation is shown in Fig. 1 and frequency characteristics of maximum sound pressure level is shown in Fig. 2.
As shown in Fig. 1, sound pressure level target plane for stress evaluation is on a 200 mm diameter sphere.
As shown in Fig. 2, sound pressure level reaches maximum at 1,333 Hz.
The phenomena that occur when reaching maximum sound pressure level is confirmed from an electromagnetic excitation force and eigen mode perspective.
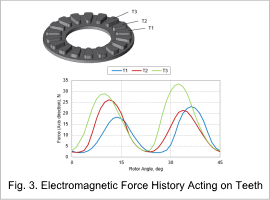
Electromagnetic Force History Acting on Teeth / Frequency Component
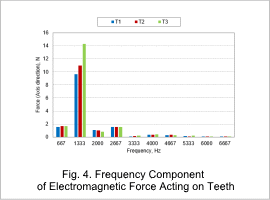
Electromagnetic force history acting on stator teeth wrapped with U phase coil is shown in Fig. 3 and frequency components are shown in Fig. 4.
In Fig. 3, you can see that the historical waveforms of electromagnetic force are not the same even for teeth wrapped in the same phase coil. Note that, the waveform for teeth wrapped in V phase or W phase coils will be out-of-phase.
In Fig. 4, you can see that the electric angle secondary component 1,333 Hz, is dominant in both teeth. This is because two rotor magnetic poles pass through in one electrical angle period.
Spatial Mode of Electromagnetic Force Acting on Teeth
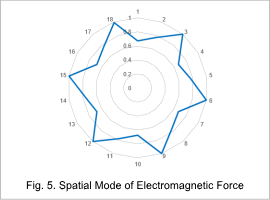
The spatial mode of electromagnetic mode with large frequency component of 1,333 Hz is shown in Fig. 5. The circumferential figures represent the teeth numbers and the radial direction figures represent the size of the electromagnetic force. Note that, the size of magnetic force is normalized at maximum value.
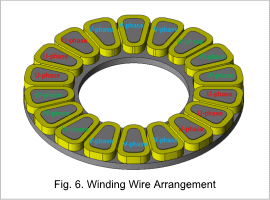
Since there are 6 peaks in one period, you can see that the sixth spatial component is dominant in the magnetic force at 1,333 Hz. As shown in Fig. 6, this is thought to be because the winding arrangement is made so there are six phases in the circumferential direction.
Acceleration Distribution
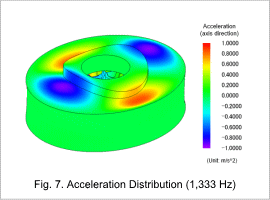
You can see that acceleration of the case is larger in the area connecting to the stator. Note that, spatial distribution of acceleration is in spatial 2nd order and is different from spatial distribution of electromagnetic force.
Eigen Mode
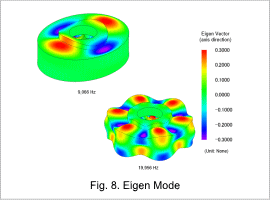
Electromagnetic force distribution is in spatial 6th order, but the natural frequency of eigen mode in spatial 6th order is extremely high at 18 kHz. Therefore, the natural frequency is thought to be greatly affected by the eigenmode of spatial 2nd order (9 kHz) which is closer to the electromagnetic excitation force frequency.


