Overview
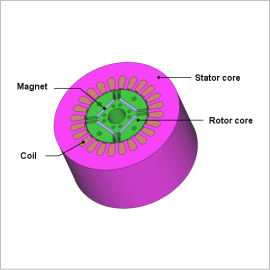
Unfortunately, it is not possible to obtain iron losses accurately in studies that use the magnetic circuit method or rules of thumb. In order to obtain them accurately, one needs to find the distribution and time variations of the magnetic flux density in each part of the motor after accounting for a fine geometry and the material’s nonlinear magnetic properties. Using the finite element method (FEM) is essential in order to carry out this kind of a detailed analysis.
This Application Note explains a case example that obtains the iron loss and its distribution in a permanent magnet motor.
Magnetic Flux Density Distribution
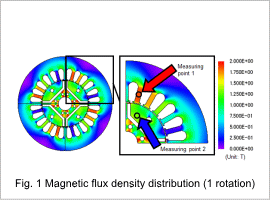
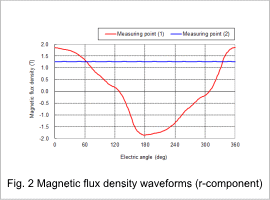
The magnetic flux density distribution of the stator core and rotor core is shown in fig. 1, and the magnetic flux density waveforms of the magnetic flux density r-component at measuring points 1 and 2 is shown in fig. 2.
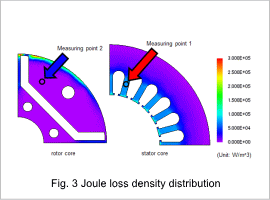
While both the value and amount of variation in the magnetic flux density at measuring point 1 are large, at measuring point 2 the magnetic flux density has a large value but a small amount of variation. These differences in magnetic flux density affect the iron loss.
Joule Loss Density Distribution/Hysteresis Loss Density Distribution/Iron Loss Density Distribution
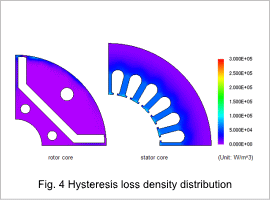
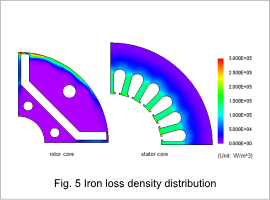
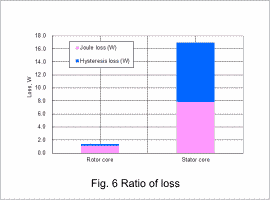
The joule loss density distributions for the stator core and rotor core are shown in fig. 3. The hysteresis loss density distributions for the stator core and rotor core are shown in fig. 4. The iron loss density distributions for the stator core and rotor core are shown in fig. 5. The ratios of loss for the stator core and rotor core are shown in fig. 6.
As shown in the magnetic flux density waveforms, joule losses are greater in places where the amount of variation in the magnetic flux density is large, compared to places where the amount of variation in the magnetic flux density is small. The same trend can be seen in the hysteresis losses as well, as shown in fig. 6 by the fact that the ratio of the joule and hysteresis losses taken up by the stator is large.
