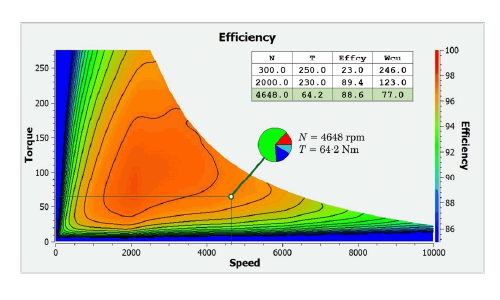
 Fig. 1 Efficiency map computed by H. Sano in JMAG for the Blue Book (Diary 52)
Progressing through the alphabet of electrical engineering topics, we come to the letter K, and for this Diary I have to say I had some difficulty finding a suitable topic beginning with K. So I borrowed the term Kennlinie from German, a language that is extremely rich in electrical engineering terms. It means characteristic curve.
Characteristic curve is ‘quite a mouthful’, and we could make a literal translation from the German — knowledge lines, or even simpler, ken-lines, since ken means to know in Old English, and is still used in northern dialects (including the local dialect in southern Scotland where I am writing). The Oxford English Dictionary also gives ken as a noun meaning power or exercise of vision, and that is what we have when we look at a modern example such as the efficiency map in Fig. 1.
The ken-lines in Fig. 1 are the contours of equal efficiency, and they are greatly enhanced by the colour-fill which is virtually a continuous gradation of colour according to the scale on the right-hand side. The colour gives an immediate impression of the conditions in any region or at any point in the map, defined by the cartesian coordinates speed and torque. These cartesian coordinates are analogous to (x,y) coordinates representing distance along the ground in two orthogonal directions, and that explains why we use the term map. Efficiency in Fig. 1 is thus the analogue of height or altitude in an ordinary contour map. Geographical contour maps generally have much less dense colour-fill because they include other features, symbols, names, and labels which would be hard to read with the dense colouration that we see in Fig. 1.
This prompts the question, why don’t we lighten the colouration in our efficiency maps and introduce more features, symbols, and labels? A suggestion can be seen in Fig. 1, where one point is picked out at 4,648 rpm and 64⋅2 Nm, and a small pie-chart is displayed showing the breakdown of the losses (Joule loss, core loss, etc.). Another enhancement is the table at top right, summarizing the efficiency and the Joule loss at three operating points.
The ken-lines in Fig. 1 are almost unnecessary, since the colouration is technically sufficient to convey all the information contained in the diagram. They do, however, increase the sense of ‘definiteness’, giving an impression of hard-and-fast immovable boundaries between regions of different levels of efficiency. Without the colour, the contours would look even more definite by themselves.
However, we only have to think of a weather chart to remind ourselves that such contour maps and ken-lines are not immutable, but are subject to many kinds of variation. In an electric machine, the efficiency at any operating point is strongly affected by the temperature distribution throughout the machine; by variations in the supply voltage; by tolerances in the manufacture; and even by aging of materials such as permanent magnets. Strictly speaking, what this means is that an efficiency map is indefinite without the precise specification of all the relevant variables at all points in the map — a huge amount of data! We should also question the accuracy of the displayed efficiency, whether it is calculated or measured. The accuracy can never be the same over a wide range of operating points, and this introduces even more uncertainty.
We can take some comfort from the language itself, because the terms characteristic curve, Kennlinie, ken-lines, locus diagrams, are understood by engineers to be just that — characteristic rather than exact, attributes that we know well enough even though we may not be able to specify them with extreme precision.
One of the most famous of these diagrams in electric machines is the circle diagram for the induction motor, introduced by Heyland in the 1890s. The example in Fig. 2 shows the locus of the current phasor in the complex plane as the slip s varies from 0 to infinity. Separate diagrams are drawn for the inner cage, the outer cage, and both cages together. Once the diagram has been drawn, the values of the current and its phase angle are both immediately available at any slip.
Fig. 3 shows the result of theoretical analysis of the circle diagram, in which many other important performance parameters are derived directly from the diagram and associated constructions.
In Figs. 2 and 3 we are looking far back into the history of AC machines. Originally the circle diagram was valued as a means of saving calculation. The saving was considerable because the calculations involve complex numbers (phasors), and these calculations were tedious in the days before calculators and computers. Moreover, the entire circle diagram could be constructed for a single-cage induction motor from the no-load and locked-rotor test data, without the need to evaluate all the parameters of the equivalent circuit. With the addition of the additional derived parameters in Fig. 3, the circle diagram seemed to be a powerful and efficient design tool.
However, the circle diagram never attained universal acceptance in the industry. One reason for this, almost certainly, is the fact that it can be severely distorted by the effects of saturation and deep-bar effect. Indeed deep-bar effect is not dissimilar to the effect of having a double cage, and we can see the distortion in Fig. 2, in which the current locus is not a circle or even part of a circle, even though the individual cages by themselves produce circular loci. We can infer from Fig. 2 that such complications spoil the essential simplicity of the circle diagram, and make it necessary to use (at the very least) an equivalent circuit with extended features.
Once the computer came to be used for electric machine calculations, equivalent circuits became easy to calculate, and these circuits were extended with additional branches and variable parameters to make them more and more accurate. By the 1980s it was becoming practical not only to support but even to replace equivalent-circuit calculations with numerical analysis such as the finite-element method, in which the physical behaviour of the machine is directly simulated according to the field equations and material properties and excitation functions. Today these developments have progressed so far, that it is commonplace to calculate maps of efficiency, power, loss components, temperature, etc. routinely in design projects, and to display them with extraordinary detail as in Fig. 1.
Does all this mean that the circle diagram is dead? Not at all. What it surely means is that the circle diagram can be calculated directly by numerical analysis without the need for an equivalent circuit, and without the need for no-load or locked-rotor test data. The variations and perturbations mentioned earlier can be taken into account in a numerical analysis, thus enhancing the circle diagram and removing one of its limitations.
The circle diagram and the efficiency map are but two examples of characteristic curves or ken-lines that may be useful in electric machine design. They show that the results of numerical analysis need not be locked away in digital storage devices, but can be displayed and used effectively in this graphical form.
Maybe all this is ‘stating the obvious’, but that’s what we will find in a Diary, along with reflections about how these things came into being and how we managed before we had our modern analysis tools. When the characteristic curves or ken-lines are computed by numerical analysis, they are really phenomenological — that is, constructed point-by-point from observations or individual calculations over a range of parameters. There is an entirely separate class of similar curves, known as locus diagrams, which are mathematically defined and independent of any physical object. The circle is itself an example, and so is its inverse in the complex plane, and so is the cissoid of Diocles (an exotic example — try an internet search!)
Here is what Bernard Hague says about the cissoid of Diocles in his unpublished book on locus diagrams (yes — an electrical engineering book!) : The name cissoid is derived from the Greek word for ivy, since the outline bounded by the two branches of the curve of Diocles and the circle bears a fanciful resemblance to an ivy leaf. It should be remarked that the initial letter ‘c’ is commonly given the sound of ‘s’ although the Greek word from which ‘cissoid’ is derived properly demands ‘k’ — an inevitable result of our irrational spelling.
The previous paragraph may seem unconnected, although it helps the search for a topic beginning with ‘k’ for this edition of the Diary; but it brings to light yet another perspective on our calculation methods and the relationship between mathematics and engineering. The vast subject of loci in mathematics is very old, and we can see in the circle diagram an example of the attempt to make our manufactured world bend and conform to the elegant constructions and algorithms of pure mathematics. But beyond the most elementary examples, it doesn’t conform: it is just too complicated. So we are left with our numerical simulations and our phenomenological ken-lines which have no innate mathematical structure or Euclidean elegance. We have passed far beyond the stage of what is possible with a ruler and compass, and we are becoming utterly reliant on digital simulation and data — lots of it.
Bibliography — Hague gives several references in the early German literature from 1858 to about 1930, but these are difficult to obtain. He also gives a couple of English-language references accessible through IEEE Xplore:
F. W. Lee, “Some graphical solutions of A-C. circuits founded upon non-Euclidian geometry,” in Journal of the A.I.E.E., vol. 45, no. 11, pp. 1078-1084, Nov. 1926, doi: 10.1109/JAIEE.1926.6537843.
V. Karapetoff, “The use of the scalar product of vectors in locus diagrams of electrical machinery,” in Journal of the American Institute of Electrical Engineers, vol. 42, no. 11, pp. 1181-1183, Nov. 1923, doi:
10.1109/JoAIEE.1923.6591533.
For information on efficiency maps, see the JMAG documentation and course materials.
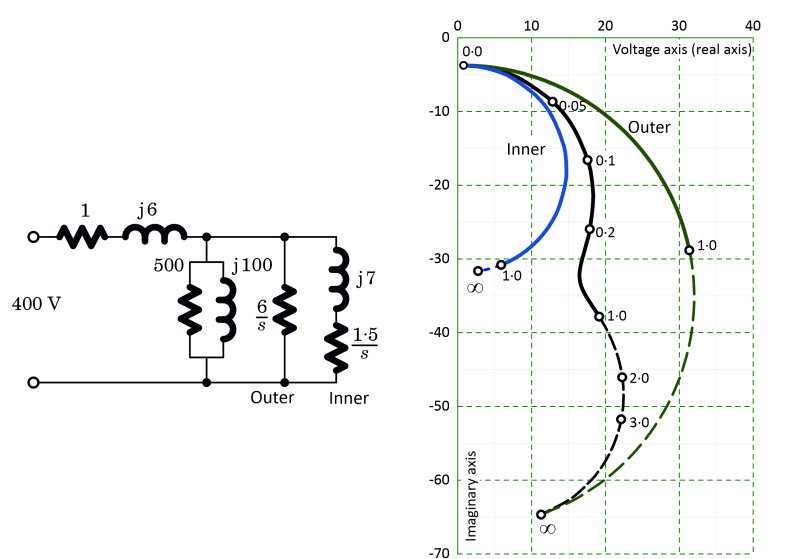 Fig. 2 Circle diagram of double-cage induction motor
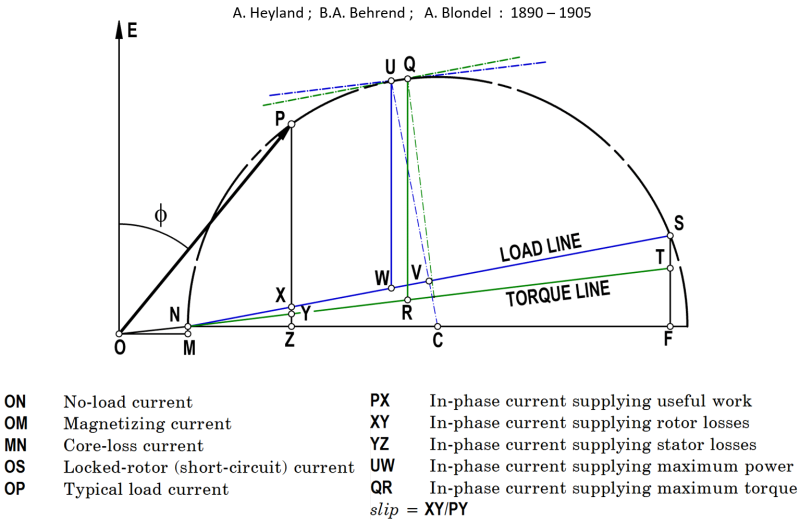 Fig. 3 Circle diagram, annotated with some derived parameters. The voltage axis is OE.


