*Please prepare a license ID and password for the license administrator.
*It is different from the service for JMAG WEB MEMBER (free membership). Please be careful.
Overview
For the evaluation of the analysis results, sometimes it is necessary to check the magnetic flux density and the magnetic field in order to observe the movement of the operating point, and to check the correlation between and physical quantities such as current and coil flux linkage in an SR motor (Fig. A). The graph manager is useful when checking the correlation of such physical quantities.
In this document, the procedure for displaying the correlation between two physical quantities on a graph is presented.
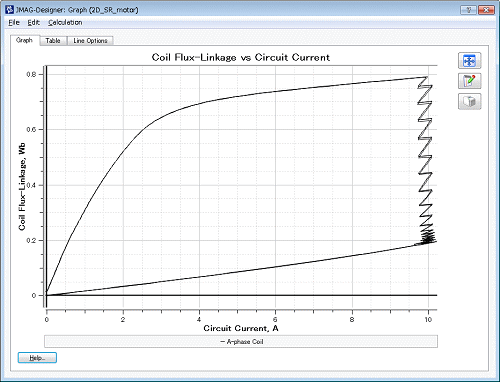 Fig. a Correlation between SR motor current and coil flux linkage.
Keywords
graph manager, lissajous, dataset, combination, correlation, graph

