Overview
In product development, design proposals are compared by varying geometry dimensions and input conditions. For this, parametric analysis that can change the values of the design parameters and evaluate the influence on the results is useful. JMAG can perform parametric analysis by using [Case Control] and setting design parameters. It is easy to check the settings for an analysis due to being able to list design parameters and values in the same window. Furthermore, JMAG can compare these results using post-functions.
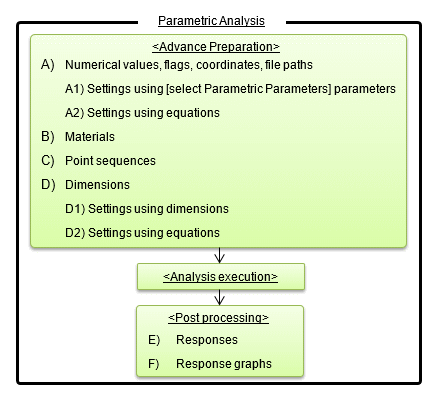
The flow of parametric analysis in JMAG-Designer is in the following order: setting design parameters (advance preparation), executing analysis, checking the results (post-processing) (Fig. a). The setting procedures for design parameters (advance preparation) are classified from A to D in Fig. a based on type of design parameter. There are also post-processing functions such as for response values and response graphs (E and F in Fig. a) to compare and evaluate results among several cases.
This document describes the procedure for setting response data and the procedure for generating response graphs from response data (E and F in Fig. a).
 Fig. a Overview of parametric analysis
Key words
parametric analysis, response data, graph


