Contents
1. Introduction
2. Return current in the edge part
3. Return current due to spatial harmonics
4 Conclusion
5. References
1. Introduction
In electromagnetic field analysis, 2D analysis (FEM) that include iron loss evaluations are widely used as a way to find a balance between finely detailed analysis and convenient analysis. Along with improving the efficiency of motors, high precision is required for iron loss analysis and it can be said that analysis methods have also advanced accordingly.
Analytical methods using FFT based on iron loss characteristics obtained by the Epstein test have been applied to eddy current loss analysis of laminated iron cores (below is the method used traditionally). Although this method produces regular results under sinusoidal AC current and at low frequency, there are cases where accuracy cannot be obtained in high frequency ranges where iron loss characteristics do not exist, and also in loss analysis when DC current is in a superimposed state. As a way to improve this, the 1D method has been proposed which solves the distribution of magnetic flux density and eddy currents that have a degree of freedom (DOF) in the thickness direction for each steel sheet.
As described above, a method for evaluating the eddy current loss in the steel sheet of a 2D analysis has been proposed, but some challenges remain. One of the challenges is the expression of a return current in the steel sheet. Since the 1D method is a method that takes into account only eddy currents in the in-plane direction, the influence of the return current portion is ignored. On the other hand, since the method until recent times also uses iron loss characteristics from a standard 30 mm width Epstein test, it has similar problems when applied to models with different magnetic circuit widths. Although 3D analysis is necessary to accurately evaluate eddy current losses in steel sheets, to do this, knowing the effectiveness and limitations of 2D analysis as well as judging the necessity of both accuracy and calculation cost is needed.
Here, the degree of influence from return current is evaluated based on the 3D analysis and the 1D method.
2. Return current in the edge part
As described above, in 2D analysis, the eddy current’s return current at the edge of the steel sheet is not taken into account, and eddy current loss is overestimated. Here, the extent that ignoring return current has on eddy current is evaluated from the ratio L / d, with the sheet thickness d and the width of L. As shown in Fig. 3, when eddy current loss was evaluated with a 1D method in the post-processing of a 2D analysis that had changed the width of L. The steel sheet thickness is 0.5 mm, and is compared with the case where eddy current loss was evaluated with a 3D analysis. The results are shown in Table 1. As the width L becomes narrower, the eddy current loss is overestimated by the 1D method using the results of a 2D analysis. The effect ignoring the return current at the edges can be estimated by the ratio of the length of the flow path of the eddy current at the return current portion to the entire flow path, and can be simply calculated as (L + d) / L. Although the values are shown in Table 1, they are mainly in agreement with the overestimated rate of the 2D analysis (1D method). Although there is a separation at L = 0.5 mm, it is thought that the eddy current does not produce a return current at right angles at the edges and that this is connected with the skin effect.

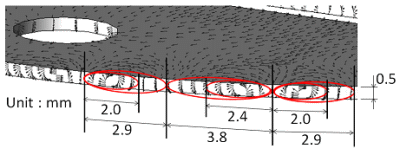
Eddy current distribution on rotor surface (3D analysis)
When looking at the rotor surface from the gap side, several vortexes can be confirmed

Distribution of slot higher harmonic
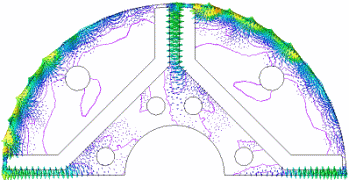
The lines represent magnetic flux lines, and the vectors represent eddy currents
You need to sign in as a Regular JMAG Software User (paid user) or JMAG WEB MEMBER (free membership).
By registering as a JMAG WEB MEMBER, you can browse technical materials and other member-only contents for free.
If you are not registered, click the “Create an Account” button.
Create an Account Sign in


