*Please prepare a license ID and password for the license administrator.
*It is different from the service for JMAG WEB MEMBER (free membership). Please be careful.
Overview
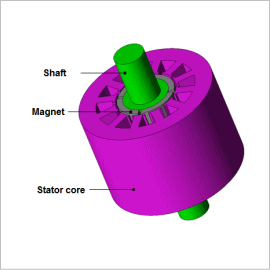
Exactly how to resolve the problem of rising temperatures is a vital issue when trying to achieve an improvement in a motor’s efficiency and output. Among the materials used in a motor, the magnet experiences the greatest variations in properties in relation to temperature. In the case of rare-earth magnets, demagnetization can occur within tens of degrees above 100 deg C. Whether they demagnetize or not depends on the reverse magnetic field applied and the temperature. They still have some resistance if either the temperature is raised only or if a reverse magnetic field is applied only, but the combination of the two causes a great reduction in resistance. A large current flows in the coils when the motor is overloaded and is producing a lot of torque, which leads to a large reverse magnetic field and heat, increasing the possibility of demagnetization. Solutions to this problem include heat-resistant magnets and increased motor size, but these lead to trade-off issues during the design stage because of the larger size and higher cost.
In order to carry out a precise evaluation of demagnetization, it is necessary to get a definite grasp of areas where a reverse magnetic field occurs and the materials’ demagnetization properties. With magnetic field analysis simulation using the finite analysis method (FEM), it is possible to calculate the reverse magnetic field and determine whether magnets and other parts demagnetize due to reverse magnetic field, taking material demagnetization properties into account.
This Application Note presents how to change the temperature of permanent magnets in an analysis, and then evaluate the effects on the torque waveform, magnetic flux density distribution, etc.
Torque Waveform
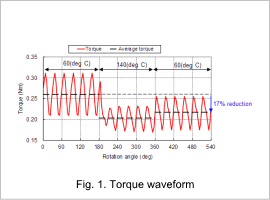
The torque waveform when the temperature of the magnet is varied from 60 deg C to 140 deg C and then back to 60 deg C for one period of electrical angle (180 deg of mechanical angle) is indicated in fig. 1.
The average torque is reduced due to thermal demagnetization when the magnet is at a temperature of 140 deg C, as indicated in fig. 1. Also, the irreversible demagnetization that occurred at 140 deg C is apparent in that the average torque is 16% lower when the temperature of the SPM motor is returned to 60 deg C.
The average torque is reduced due to thermal demagnetization when the magnet is at a temperature of 140 deg C, as indicated in fig. 1. Also, the irreversible demagnetization that occurred at 140 deg C is apparent in that the average torque is 16% lower when the temperature of the SPM motor is returned to 60 deg C.
Magnetic Flux Density Distribution
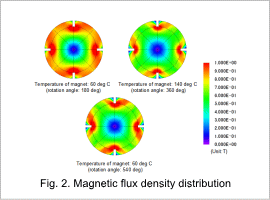
The magnetic flux density distributions under the different conditions are shown in fig. 2.
From the figure, it can be seen that the overall magnetic flux density is lower at 140 deg C compared to before the temperature is raised. It can also be seen that it does not return to its original state even after the temperature is returned to 60 deg C.
From the figure, it can be seen that the overall magnetic flux density is lower at 140 deg C compared to before the temperature is raised. It can also be seen that it does not return to its original state even after the temperature is returned to 60 deg C.
Demagnetizing Ratio Distribution
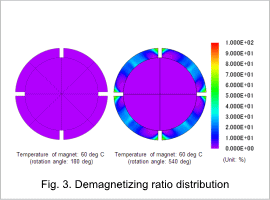
Fig. 3 shows the demagnetization ratio (*1) distribution after the temperature is returned to 60 deg C, with magnetization conditions prior to the raised temperature as a standard. The demagnetization shown here is irreversible demagnetization from going over the knee point, and indicates that the magnet properties have worsened.
It can be seen from the figure that even when the magnet is returned to 60 deg C, there is demagnetization across a wide range compared to before.
(*1) The demagnetization ratio shows whether demagnetization has occurred from the specified standard magnetization.
It can be seen from the figure that even when the magnet is returned to 60 deg C, there is demagnetization across a wide range compared to before.
(*1) The demagnetization ratio shows whether demagnetization has occurred from the specified standard magnetization.
Operating Point
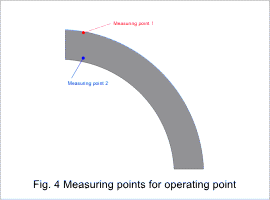
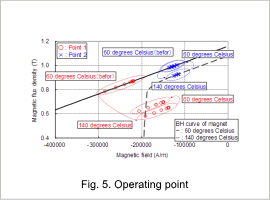
The measuring points selected to confirm operating points are shown in fig. 4, and the operating points are shown in fig. 5.
In fig. 5, it can be seen that irreversible demagnetization has occurred because the operating point exceeds the knee point at measuring point 1 after heat is added and the operating point does not return to the original B-H curve after the temperature is reduced to 60 deg C. The size of the reverse magnetic field acting on each element can also be seen on the horizontal axis.
