*Please prepare a license ID and password for the license administrator.
*It is different from the service for JMAG WEB MEMBER (free membership). Please be careful.
Overview

A flyback converter is a well-known system for small capacity power supplies in the several-dozen W class. They are cheap and have a simple structure, so they are widely used as converters for pressurization in home appliances. In recent years there has been a trend toward making small-scale switching transformers even smaller and higher-frequency, so it is not rare to see converters using the flyback system drive 100 kHz or more.
Because of the higher frequencies and smaller scales of transformers, an important challenge of how to control their heat generation has emerged in the design process. The losses that produce heat can be separated into copper loss in the coil and iron loss in the core. Copper loss is distributed inside of the coils because of the proximity effect, which is caused by influence from the skin effect and leakage flux. This means that local heat generation in the coils becomes a problem.
Iron loss also has a complex distribution because it depends on the magnetic flux density distribution that accounts for the core’s magnetic saturation, so the core’s local heat generation becomes a problem as well.
A magnetic field analysis simulation based on the finite element method (FEM) can precisely evaluate the complex loss distributions of the coil and core, so it is optimal for an advance study of a switching transformer’s thermal design.
Iron Loss Density Distribution

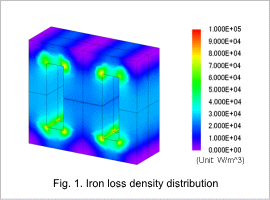
Fig. 1 shows the iron loss density distribution.
From the figure, it is apparent that iron losses increase in the inside corners. This is caused by the flow of magnet flux concentrating on the shortest path through the magnetic circuit.
From the figure, it is apparent that iron losses increase in the inside corners. This is caused by the flow of magnet flux concentrating on the shortest path through the magnetic circuit.
Copper Loss Density Distribution

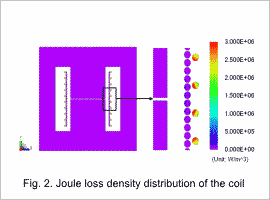
Fig. 2 shows the coil’s joule loss density distribution when the maximum current is flowing through the primary coil.
The joule losses are larger around the gap, as indicated in this figure. These joule losses are produced by the leakage flux from the gap that causes the current distribution in the wires to be uneven.
The joule losses are larger around the gap, as indicated in this figure. These joule losses are produced by the leakage flux from the gap that causes the current distribution in the wires to be uneven.
Percentage of Loss

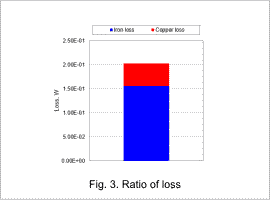
The percentages of the iron and copper losses are indicated in Fig .3. As the Figure indicates, the iron losses are dominant in this transformer.


