*Please prepare a license ID and password for the license administrator.
*It is different from the service for JMAG WEB MEMBER (free membership). Please be careful.
Overview
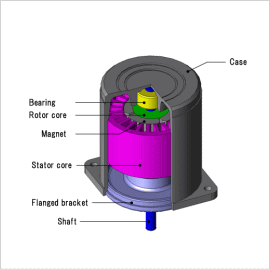
As electric motors are becoming more common, motors which create less noise are in high demand. Sound can be divided into categories of electromagnetic noise, mechanical noise, and draft noise, where electromagnetic noise is the most common for medium and small sized motors. Sound can be divided into categories of electromagnetic noise, mechanical noise, and draft noise, where electromagnetic noise is the most common for medium and small sized motors.
The electromagnetic force in a motor vibrates as an electromagnetic excitation force which creates noise. The vibration and noise are generated when the electromagnetic excitation force resonates with the motor’s eigenmodes. In order to evaluate this phenomenon more accurately, it is necessary to understand the distribution of electromagnetic force that moves the stator core which is the basis for the radiated sound. The distribution of electromagnetic force or the eigen modes in a model that depends on the geometry of a stator core is required for running an analysis such as for the finite element analysis.
This Application Note shows an example of an evaluation of a reactor’s sound pressure, when acquiring electromagnetic force generated by a stator core for a SPM motor and linking the eigen modes of a motor.
Electromagnetic Force
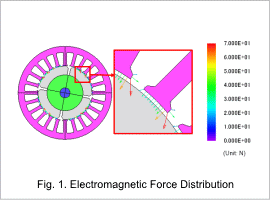
Fig. 1 shows the distribution of the electromagnetic force distribution. A strong output of electromagnetic force can be seen at the tips of the teeth. From these results, it can be expected that the stator core is generating a strong force in a radial direction.
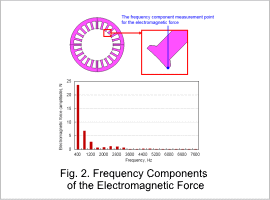
The results of a resolution in a frequency component for an electromagnetic force in a radial direction on the tips of the teeth is shown in fig. 2. From these results, the frequency component in 400 Hz is the most common. From these results, the frequency component in 600 Hz is the most common and the frequency component in 5000 Hz is very small.
Eigenmode
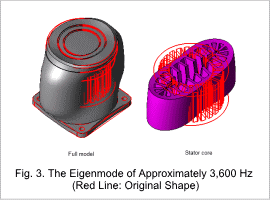
The eigenmode near 3,600 Hz is shown in fig. 3. It is apparent that a mode in deformation exists in a stator of ellipse near 4,200 (Hz) and a large vibration is going to be generated from the resonance phenomenon between an eigen mode and an electromagnetic force.
Acceleration
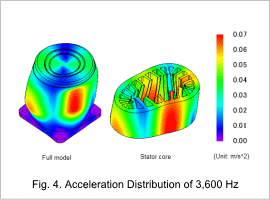
Fig. 4 shows the distribution of the acceleration at 3,600 Hz. This is the frequency in which the mode that deforms elliptically (displayed in the eigenmode analysis) appears. At 3,600 Hz, it can be seen that electromagnetic resonance is occurring between the electromagnetic force and the eigenmode shown in fig. 3.
Sound Pressure Distribution
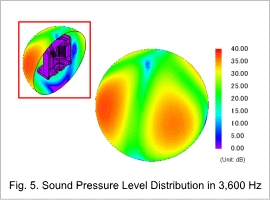
The sound pressure distributions at 3,600 Hz are shown in fig. 5. Like with the distribution of acceleration, at 3,600 Hz an electromagnetic resonance occurs between the electromagnetic force and the eigenmode shown in fig. 3.


