Overview
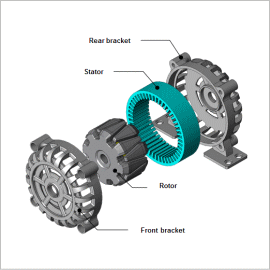
In this example, the electromagnetic force generated in the stator core of a claw pole alternator is obtained, and acceleration is evaluated with an electromagnetic force – structural coupled analysis on the alternator. In addition, the frequency components of the electromagnetic force and the eigenmodes and spatial modes are analyzed to obtain the sources of resonance.
Electromagnetic Force
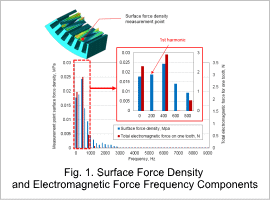
The electromagnetic force distribution for one electrical angle period at steady-state is obtained. When rotating a 16-pole rotor at 1,500 r/min, 200 Hz is the fundamental frequency. Fig. 1 shows the electromagnetic force frequency components.
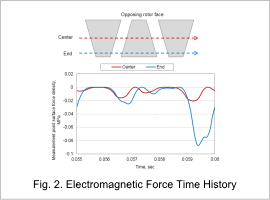
In general, the electromagnetic force acting on a stator tooth has a frequency component (secondary component) which is twice the fundamental frequency, but if the rotor is a claw-pole rotor, since the N-pole and S-pole widths are different, the fundamental component is included as well. In particular, the magnitude of the fundamental component included differs between the axial center and either end of a claw pole. Fig. 2 shows the electromagnetic force time history.
Eigenmode
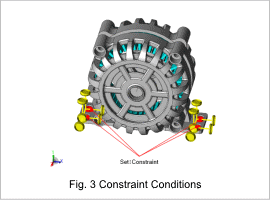
The stator is fixed between the front and rear brackets. Since each part is connected using bolt holes, rigid body conditions are used to model these connections. In addition, the bolt holes for mounting the rear bracket are completely constrained simulating a mounted bracket.
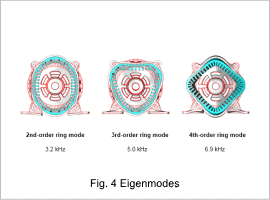
Fig. 3 shows the constraint conditions. Fig. 4 shows the 2nd- to 4th-order ring modes and their eigenfrequencies of the stator.
Sound Pressure Level Evaluation and Vibration Analysis
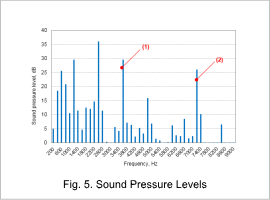
Vibration analysis is performed for each electromagnetic force frequency component obtained from magnetic field analysis in order to determine sound pressure levels. Fig. 5 shows the sound pressure levels
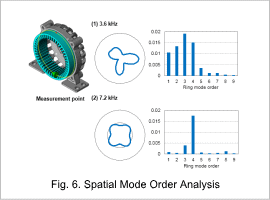
The ring modes can be checked by computing the vibration spatial modes from accelerations of the stator outer circumference at 3.6 kHz and 7.2 kHz. Fig. 6 shows the spatial mode order analysis.
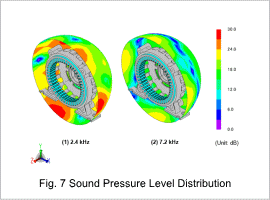
It can be seen that the effects from the 3rd- and 4th-order ring modes are large. Fig. 7 shows the sound pressure level distribution.
