*Please prepare a license ID and password for the license administrator.
*It is different from the service for JMAG WEB MEMBER (free membership). Please be careful.
Overview
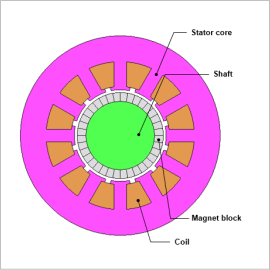
In general, when the magnetic flux density of a gap approaches a sine wave, harmonic components are suppressed and efficiency improves. A method exists to locally change the coercive force of magnets used in SPM to bring magnetic flux density closer to a sine wave. However, the proper coercive force of magnets is difficult to find through a process of trial and error. In situations such as these, by using optimization, coercive force distribution can be obtained effectively.
In this example, a magnet is segmented into blocks and coercive force is defined. The coercive force of each block is calculated so that the induced voltage waveform approaches a sine wave through optimization. Coercive force distribution obtained through optimization and the voltage waveform for the same coercive force distribution are compared.
In this example, a magnet is segmented into blocks and coercive force is defined. The coercive force of each block is calculated so that the induced voltage waveform approaches a sine wave through optimization. Coercive force distribution obtained through optimization and the voltage waveform for the same coercive force distribution are compared.
Rotor Magnetization
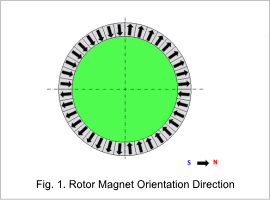
The number of poles of the target motor is 4. Therefore, the angle between two poles is 90 degrees.
1 pole uses a magnet block divided into 9 every 10 deg. These are magnetized in the radial direction.
Fig. 1 displays the rotor magnet orientation direction.
1 pole uses a magnet block divided into 9 every 10 deg. These are magnetized in the radial direction.
Fig. 1 displays the rotor magnet orientation direction.
Spatial Magnetic Flux Density Evaluation
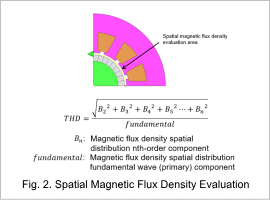
Fig. 2 shows the spatial magnetic flux density evaluation.
The spatial magnetic flux density is found when the rotor is fixed at no load.
To determine whether close to a sine wave, the total harmonic distortion (THD) that represents the degree of signal distortion is used. Since THD is the ratio of the square root of the sum of the squared harmonic components to the fundamental component, the smaller the THD the closer the induced voltage waveform is to a sine wave.
A different coercive force for each magnet block is set and the THD value is evaluated.
Optimization Conditions
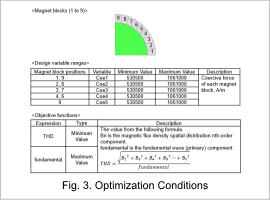
Fig. 3 shows magnet blocks as design variables, design variable ranges, and objective functions.
Design variables are the coercive forces of each magnet block, and the minimum and maximum values indicate the search range.
The primary goal is to minimize THD, but in order to prevent sufficient torque not being obtained due to low spatial magnetic flux density, a constraint is imposed to maximize the fundamental.
By satisfying these, the generated magnetic flux density is at a maximum and the waveform is close to a sine wave.
Objective functions are set to maximize the fundamental and minimize THD using the above gap magnetic flux density evaluation formula.
Pareto Curve
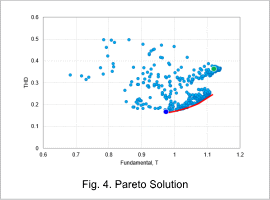
Fig. 4 shows the Pareto curve of the optimization results.
The point shown in green is the initial design, and the points shown in blue are the results obtained from optimization. Here, the design proposal with the smallest THD among the design proposals on the Pareto curve is adopted. The design proposal obtained by optimization is smaller in both fundamental and THD compared to the initial period.
The point shown in green is the initial design, and the points shown in blue are the results obtained from optimization. Here, the design proposal with the smallest THD among the design proposals on the Pareto curve is adopted. The design proposal obtained by optimization is smaller in both fundamental and THD compared to the initial period.
Magnet Block Coercive Force
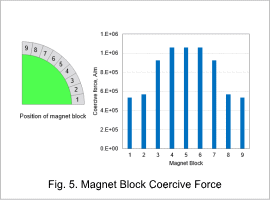
Fig. 5 shows the magnet block coercive force at the blue point obtained with optimization.
It is understood from the graph that coercive force near the pole center increases
It is understood from the graph that coercive force near the pole center increases
THD of the Initial Case and Optimum Case
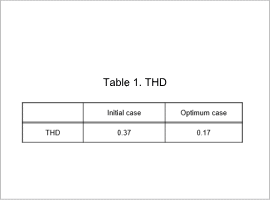
Both initial period and optimized THD is shown is Table 1.
Compared to the initial period, optimized THD becomes a value of 1/2 or less. From this, it can be described that the optimization case has a lower ratio of spatial harmonics to the fundamental wave than the initial case, and is a waveform close to a sine wave.
Compared to the initial period, optimized THD becomes a value of 1/2 or less. From this, it can be described that the optimization case has a lower ratio of spatial harmonics to the fundamental wave than the initial case, and is a waveform close to a sine wave.
Spatial Magnetic Flux Density Waveform
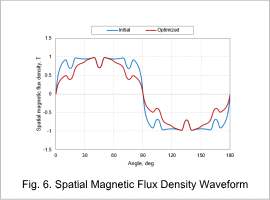
Radial direction spatial magnetic flux density waveforms are displayed in Fig. 6.
Peaks and valleys are thought to be produced by the positions and angles of the magnets. However, by optimizing the magnet block coercive forces, it can be confirmed that the spatial magnetic flux density has become a waveform close to a sine wave. This is consistent with the results in Table 1 above.
Peaks and valleys are thought to be produced by the positions and angles of the magnets. However, by optimizing the magnet block coercive forces, it can be confirmed that the spatial magnetic flux density has become a waveform close to a sine wave. This is consistent with the results in Table 1 above.
Induced Voltage Waveform
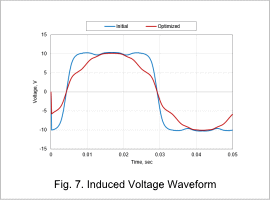
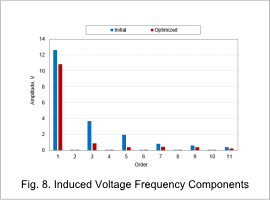
Fig. 7 shows the induced voltage waveform, and Fig. 8 shows the induced voltage frequency components.
Similar to the prior THD and spatial magnetic flux density waveform evaluation results, it can be confirmed that this nears a sine wave through optimization.
