Overview
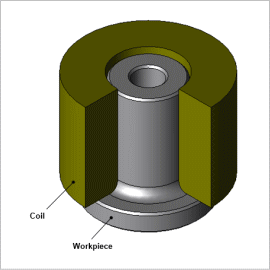
Optimization using FEA is effective in reducing prototyping costs and reducing the construction period. In parameter optimization using design variables and dimension ranges, although knowledge and experience is required to determine parameters, because searches can be performed for topology optimization without depending on the initial shape, design proposals with a high degree of freedom can be obtained.
In this example, magnetic field and thermal coupled analysis is run, and using topology optimization, searches are performed for a heating coil that maximizes the power factor and minimizes the apparent power.
Optimization conditions
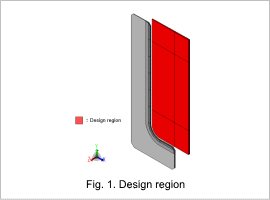
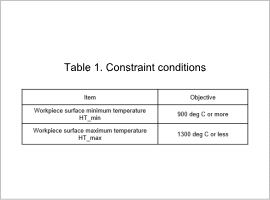
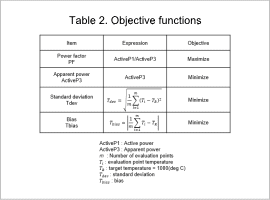
The design region is shown in Fig. 1, the constraint conditions are shown in Table 1, and the objective functions are shown in Table 2.
Define the following four points in the objective functions.
- Power factor maximization
- Apparent power minimization
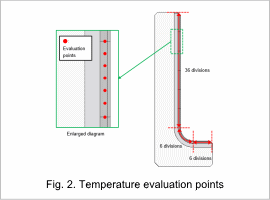
- Minimizing the standard deviation Tdev from the target temperature 𝑇_𝑅 using the evaluation point temperature 𝑇_𝑖 (Fig. 2)
- Minimizing the bias Tbias from the target temperature 𝑇_𝑅 using the evaluation point temperature 𝑇_𝑖 (Fig. 2)
The temperature evaluation points are shown in Fig. 2.
Optimization Results
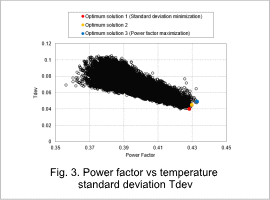
The correlation diagram between the coil power factor and the temperature standard deviation Tdev is show in Fig. 3.
The case with the minimum temperature standard deviation Tdev is Optimum solution 1, the case with the maximum power factor is Optimum solution 3, and the one case between Optimum solution 1 and Optimum solution 3 is Optimum solution 2.
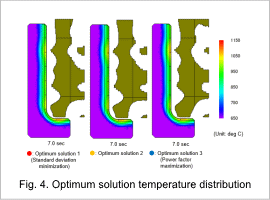
The topology optimization shapes for optimum solutions through 1 to 3, and the temperature distribution contours during heating at 7.0 sec are both shown in Fig. 4.
In each optimum solution, the coil surface facing the workpiece has a wavy shape, whereas the lower part of the coil has a shape that follows along the workpiece. It is understood that the workpiece surface is heated evenly in each case.
Sensitivity Analysis
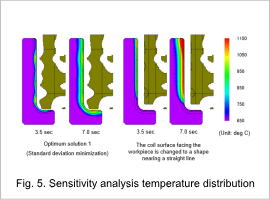
Fig. 5 shows Optimum solution 1 which is the case where the temperature standard deviation Tdev is the minimum value, as well as the temperature distribution of the case where the coil surface facing the workpiece is changed to a shape that is near to a straight line.
In the case where the coil surface is changed to a shape that is near to a straight line, the upper part of the workpiece is heated first. The workpiece surface temperature is not uniform even if heat transfer occurs within the workpiece. Conversely, in Optimum solution 1, multiple points where the coil is asymptotic to the workpiece are heated first. The workpiece surface temperature then becomes uniform due to the heat transfer. It is understood that the wavy shape of the coil surface is important for uniform temperature.


