Overview
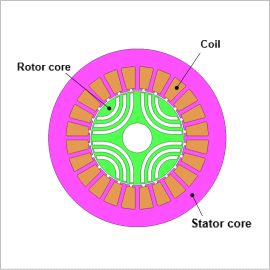
Topology optimization allows for bold changes in material arrangement when exploring the design region, and is an effective method for generating concepts at the early stages of design when there are few geometry constraints.
In this example, topology optimization is used to minimize the torque ripple and maximize the average torque when exploring the rotor geometry.
Optimization Condition
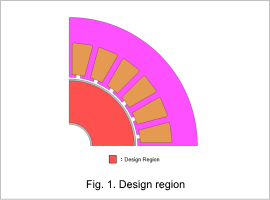
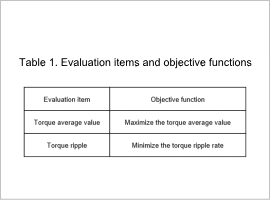
Fig. 1 shows the design region and Table 1 shows the evaluation items and objective functions. Fig. 1 shows that the rotor perimeter and area near the shaft are excluded from the design region with consideration for the actual manufacturing of the motor.
Optimization Results
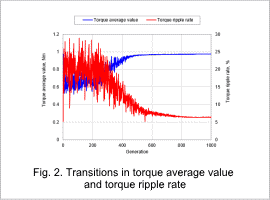
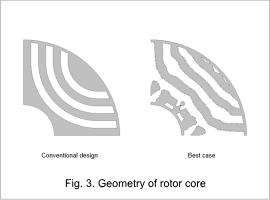
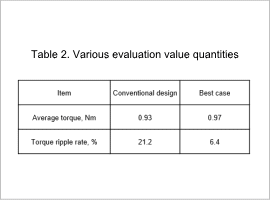
Fig. 2 shows the transitions in the torque average values and torque ripple rates for the best case of each generation. Fig. 3 shows the rotor core geometry in conventional design and the best case throughout all generations, with various quantities shown in Table 2.
As the generation progresses, it can be seen that the torque average value grows larger and the torque ripple rate becomes smaller as they converge.
It is understood that in the best case, a comparison to the conventional design shows that the average torque is raised by 4 % and the torque ripple rate is lowered by 70 %.
Reluctance Torque
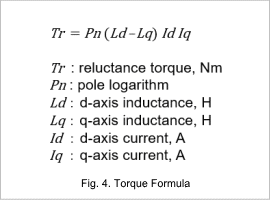
In a reluctance torque, the average value is larger when the difference between the d-axis inductance and q-axis inductance is large, and the ripple decreases as the change in difference is small.
q-axis Inductance
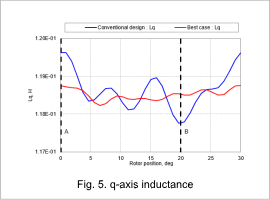
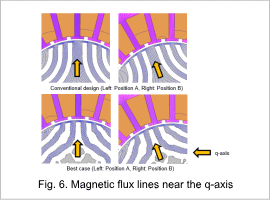
Fig. 5 shows the waveform of the q-axis inductance. Fig. 6 shows the magnetic flux line near the q-axis for each timing with Position A (0 deg) as the timing when magnetic flux flows most easily in the q-axis direction and with Position B (20 deg) as the timing when magnetic flux is least likely to flow in the q-axis direction in a conventional design.
In Fig. 5, it can be seen that in the best case the change in q-axis inductance is small compared to conventional designs.
In Fig. 6, it can be seen that magnetic flux flows easily when the core on the q-axis is facing the teeth and does not flow well when it is not facing the teeth. In the best case, compared to the conventional design, the flux barrier generated on the q-axis makes it difficult for the magnetic flux to flow easily when the q-axis is facing the teeth and makes it flow easily when it is not facing the teeth. It can be seen that the change is kept small and this reduces the torque ripple.
d-axis Inductance
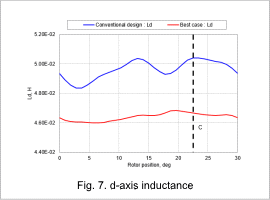
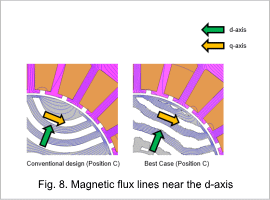
Fig. 7 shows the waveform for the d-axis inductance. Fig. 8 shows the magnetic flux lines near the d-axis with Position C (22.5 deg) as the timing when magnetic flux flows most easily in the d-axis direction in a conventional design.
In Fig. 7, it can be seen that the d-axis inductance is smaller in the best case compared to the conventional design.
In Fig. 8, it can be seen that the magnetic flux flowing in the d-axis direction is suppressed by the flux barrier which extends in the q-axis direction in the best case. This increases the difference between the d-axis and q-axis inductance, resulting in a higher average torque.
