Please enter your username and password to sign in.
* A JMAG Software User (paid user) account is required.
*It is different from the service for JMAG WEB MEMBER (free membership). Please be careful.
Overview
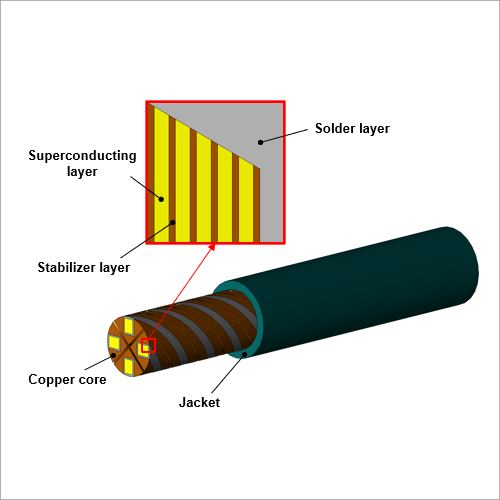
The development of high-current assembled conductors, which bundle high-temperature superconducting (HTS) tapes, is underway for fusion reactor magnets. In stacked HTS conductors, the proximity effect during pulsed current operation causes the current to concentrate at the outer periphery. This leads to major challenges, such as increased transport losses and an uneven current distribution (current maldistribution) near the center of the conductor. Accurately capturing the electromagnetic phenomena inside the conductor while accounting for its complex internal structure is effective for the optimal design of HTS conductors.
In this example, 3D finite element analysis is used to evaluate the losses and current distribution during pulsed current operation in both straight and twisted configurations of a VIPER conductor, which is a type of twist-stacked tape cable.
In this example, 3D finite element analysis is used to evaluate the losses and current distribution during pulsed current operation in both straight and twisted configurations of a VIPER conductor, which is a type of twist-stacked tape cable.
Losses and Current Density Distribution
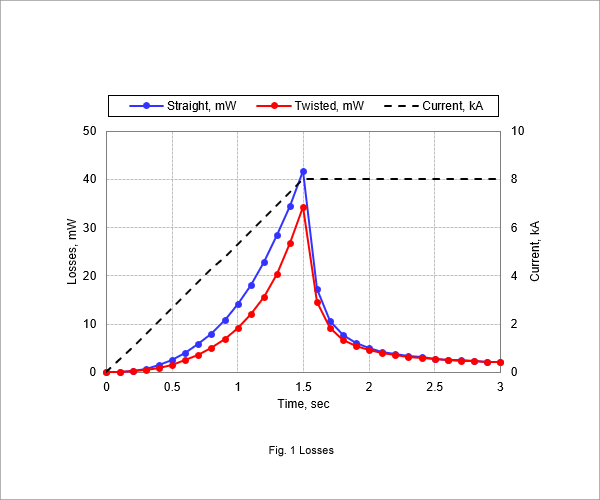
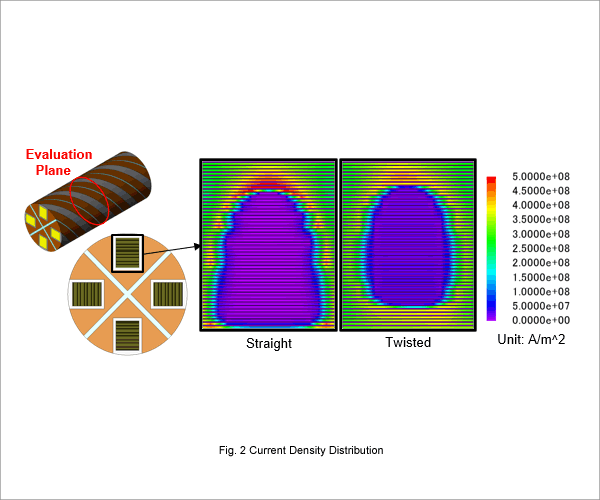
Fig. 1 compares the losses for the straight and twisted configurations. Fig. 2 illustrates the current density distribution in the superconducting layer at 1.5 seconds.
Fig. 1 shows that the loss peaks at 1.5 seconds, when the current reaches its maximum. It can be seen that the loss is reduced from 41.7 mW in the straight configuration to 34.2 mW in the twisted configuration.
As illustrated by Fig. 2, current density is concentrated on the outer edges of the stacked HTS tapes in the straight configuration. In contrast, the twisted configuration reduces localized high-current-density regions. This is because twisting mitigates the proximity effect and distributes current to the superconducting layers near the center of the conductor.