*Please prepare a license ID and password for the license administrator.
*It is different from the service for JMAG WEB MEMBER (free membership). Please be careful.
Overview
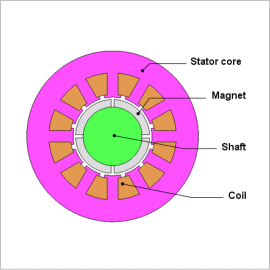
Rare earth magnets has characteristics of large energy product, but decrease when using in an area exceeding a knee point causing irreversible demagnetization. For motors, the possibility of thermal demagnetization through thermal stress may occur when the magnet temperature rises due to iron loss or copper loss during rotation. Large amounts of electric currents are run through an excitation coil where demagnetization may occur when a reverse magnetic field is applied on a magnet. Demagnetization of magnets in a motor is one of the causes of decrease in motor performance, where whether or not performance has decreased demagnetization needs to be predicted.
The magnetic field analysis simulation can handle magnetic fields or temperature generated in an internal magnet which can evaluate demagnetization on the edges of a magnet accurately.
This note presents the use of a magnetic field analysis to evaluate the demagnetizing ratio distribution of an of an SPM motor by changing the current flow.
Magnetic Flux Density Distribution
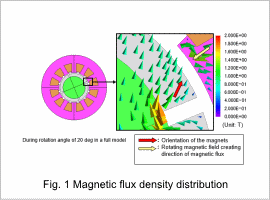
Fig. 1 shows the magnetic flux density for current 30 A, and rotation angle of 20 deg. Demagnetization occurs at the end of the magnet because the orientation of the magnet and the direction of the flux generated by the rotating magnetic field are opposed.
Operating Point
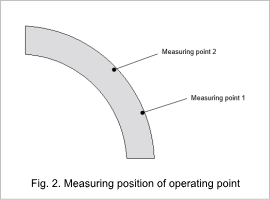
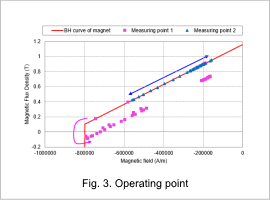
The measuring points selected to confirm operating points are displayed in fig. 2, and operating points for each measuring point in current 30 A are displayed in fig. 3. Measuring point 1 in fig. 3 is not set on a BH curve based on the operation point where an irreversible demagnetization occurs. The size of the reverse magnetic field imposed upon each measuring point is also illustrated on the horizontal axis.
Permeance Coefficient Distribution
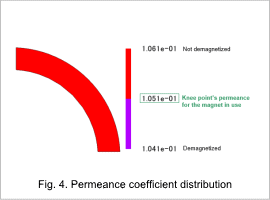
Fig. 4 shows the permeance coefficient distribution of the magnet when the motor is stationary with no load. The knee point’s permeance is shown in two colors, that are red and purple. The knee point of the magnet is used for the analysis is 0.1051. Fig. 4 shows that no demagnetization occurs when the motor is stationary with no load.
Demagnetizing Ratio Distribution
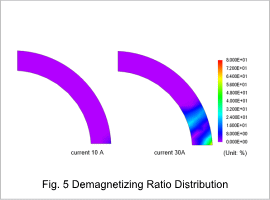
Fig. 5 uses the no-load static state as a benchmark to show the demagnetizing ratio* distribution when rotating the rotor one period of electric angle with no load after demagnetization. As the current increases, both the demagnetizing area and demagnetizing ratio increases.
* The demagnetizing ratio is the amount of demagnetization from the standard magnetization that is specified.
* The demagnetizing ratio is the amount of demagnetization from the standard magnetization that is specified.
Induced Voltage Waveform
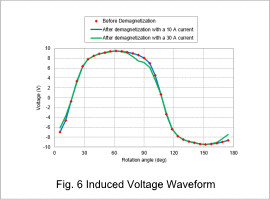
Fig. 6 shows the induced voltage waveform of the U-phase coil when rotating the rotor one period of electric angle with no load before and after demagnetization. When the amount of current is set to 30 A, it becomes apparent that demagnetization causes the induced voltage waveform to change.


