*Please prepare a license ID and password for the license administrator.
*It is different from the service for JMAG WEB MEMBER (free membership). Please be careful.
Overview
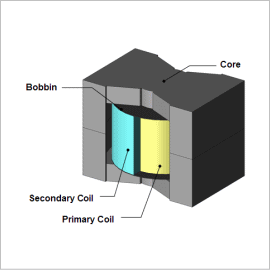
In recent years, the demand to reduce vibration and noise is growing while the requirements for higher efficiency and smaller and lighter transformers grow with environmental conservation trends. The primary cause of noise for transformers is the electromagnetic vibrations and the resonance phenomena at the eigenfrequency of the structure. A sound pressure analysis can be performed with a coupled magnetic field and structural analysis that uses the electromagnetic force as excitation force.
This example presents the use of a coupled magnetic field and structural analysis to obtain the sound pressure distribution accounting for the electromagnetic force of the core when the transformer is operating on a power supply frequency of 6 kHz.
This example presents the use of a coupled magnetic field and structural analysis to obtain the sound pressure distribution accounting for the electromagnetic force of the core when the transformer is operating on a power supply frequency of 6 kHz.
Electromagnetic Force Distribution
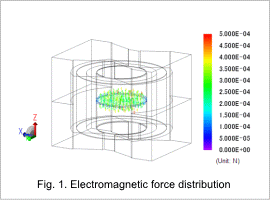
Fig. 1 shows the electromagnetic force distribution of the core while driven.
From the figure, it can be seen that a large force is generated in the Z-axis direction in the gap. Also, because this electromagnetic force works as an attraction force, the frequency is 12 kHz, double the power supply frequency.
From the figure, it can be seen that a large force is generated in the Z-axis direction in the gap. Also, because this electromagnetic force works as an attraction force, the frequency is 12 kHz, double the power supply frequency.
Eigenmode
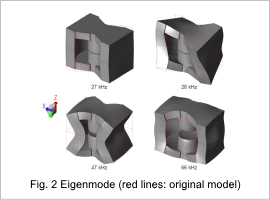
The Eigenmode of the transformer are indicated in fig. 2.
This shows that there is not much deformation in the Z-axis direction in the low-order Eigenmode, relatively close to the electromagnetic force’s frequency of 12 kHz. Modes where the area around the gap deforms in the Z-axis direction include 47 kHz and 66 kHz.
This shows that there is not much deformation in the Z-axis direction in the low-order Eigenmode, relatively close to the electromagnetic force’s frequency of 12 kHz. Modes where the area around the gap deforms in the Z-axis direction include 47 kHz and 66 kHz.
Acceleration Distribution
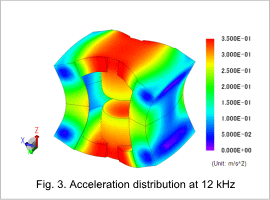
The acceleration distribution at 12 kHz is shown in fig. 3.
The deformation modes are larger at 47 kHz and 66 kHz, as indicated in this figure. This is because the electromagnetic force generated near the core’s gap and the deformation modes at 47 kHz and 66 kHz are in the same Z-axis direction. The figure also shows that the deformation in the core’s sides increases with the attraction force in the gap.
However, there are no resonance phenomena because the frequency of the electromagnetic force is sufficiently smaller than the Eigen frequency.
Sound Pressure Distribution
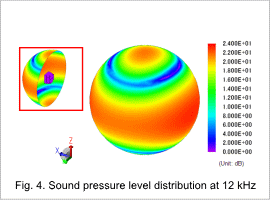
The sound level distribution at 12 kHz is shown in fig. 4.
The sound pressure is higher in the Z-axis direction, in which the electromagnetic force works, and in the X-axis direction, in which the core’s deformation is larger. The reason why the sound pressure levels are not too high is that the electromagnetic frequency of 12 kHz and the Eigen frequencies of the deformation modes that greatly influence the electromagnetic vibration are far apart.
The sound pressure is higher in the Z-axis direction, in which the electromagnetic force works, and in the X-axis direction, in which the core’s deformation is larger. The reason why the sound pressure levels are not too high is that the electromagnetic frequency of 12 kHz and the Eigen frequencies of the deformation modes that greatly influence the electromagnetic vibration are far apart.

