Motor Development Using JMAG
Vibration noise has become an unavoidable issue when dealing with electrical equipment in recent years and it seems magnetic circuit designers are somewhat distant from vibration sound analyses. In this series, I would like to give a description of initiatives toward a vibration noise analysis where electromagnetic force obtained from JMAG acts as the vibratory source. I'd like to focus on motors for the first entry in this column and describe modeling methods to get a grasp on an analysis of resonance from electromagnetic force and eigenfrequency. It would be wonderful if motor designers not involved in electromagnetic vibration took it on or joined with machinery designers to devise methods to counteract vibration noise.
Overview
As demands for motors to become smaller and denser, there has been a trend for vibration and noise to increase. This is particularly evident with electromagnetic vibration where electromagnetic force is the vibratory force. There are growing requirements for reduced vibration and noise. Using simulation enables understanding the cause of vibrations and allows the prediction of vibration noise and devising of countermeasures against it.
In this edition, I'd like to describe modeling methods to gain a grasp of resonance from electromagnetic force and eigenfrequency, which is one of the initiatives made using JMAG regarding vibration noise analysis in motors. I'll also describe modeling and electromagnetic force evaluation to estimate vibration and noise in electromagnetic calculations. And, when it comes to the eigenfrequency calculation, I will touch on modeling of magnetic steel sheet (stator core), rotor and coil, as well as contact modeling between stator core and frame and frame and cover. I will describe modeling using JMAG's structural analysis function, as well as coupling with other software.
Motor Specifications and Analysis Assumptions
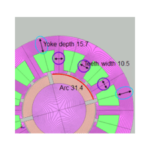
Vibration sound analysis modeling methods vary according to motor specifications, so I'll kick off by showing the motor geometry we'll use for this article (Fig. 1, Table 1).
Now I'll explain the analysis assumptions. For this article, we're going to look at noise in the several kHz band as it's the noise most grating on the ears. For motors in the several kHz band that we're going to look at, the band has an eigenfrequency in the lower order of the stator core. With the rotor core, however, the eigenfrequency is in a high frequency region of at least 5kHz in the lower order. We won't be allowing for the impact of rotor bias as the electromagnetic force generated in the rotor has only a negligible effect on the housing or upper and lower parts of the cover. Consequently, I'd like to look at modeling methods to gain a grasp of resonance effects from electromagnetic force and eigenfrequency generated in the stator core.
 Fig. 1 Motor geometry
Table 1 Motor specifications
Vibration Noise Analysis using JMAG
JMAG is not merely software with electromagnetic field analysis functions that performs highly accurate calculations, it also has structural analysis functions, so is capable of carrying out all calculations related to vibration noise in electrical equipment. Doing all the calculations in JMAG smoothens transfer of electromagnetic force and enables unified operation methods, making it extremely beneficial for conducting vibration structural analyses, which even electromagnetic circuit designers are unaccustomed to. The flow of the vibration noise analysis is as outlined below (Fig. 2).
 Fig. 2 Analysis Flow
Electromagnetic force calculation for the vibration noise analysis
Electromagnetic Force Calculation Modeling
In electromagnetic force calculations, you need to create an electromagnetic field analysis model that will obtain accurate electromagnetic force at the frequency of the vibration or noise that you want to evaluate. What that means is that it's important to have the time intervals and mesh divisions to express electromagnetic force variations at the frequency the several kHz band that you wish to evaluate. Generally, you should be wary that models analyzing induced voltage waveforms or torque in design workplaces aren't really good enough for the jobs they're being required to perform.
When it comes to time intervals, I recommend you have at least eight divisions in every period of a frequency you want to evaluate. Of course, you can divide more than that, but I recommend you divide fewer times and then compare the results you attain with those from eight divisions to check on the effect of dividing.
For mesh divisions, JMAG has a rotation periodic mesh function that automatically recognizes the geometry and generates a mesh allowing for periodicity and symmetry. Using this function will generate a high quality mesh and enable obtaining of highly accurate electromagnetic force.
Confirming the Electromagnetic Force Mode
JMAG not only finds out about space distribution of electromagnetic force generated in places such as between the teeth of the stator, it can also confirm the electromagnetic force mode, which is the space distribution for each time harmonic component in electromagnetic force. Separate the DC components with large electromagnetic force and the harmonic component, which is decided by the number of poles and slots before checking. For example, with four poles and 24 slots, confirm the mode number from the electromagnetic force vectors of the DC components, the 4th-, 12th- and 24th-order components which are decided by the number of poles and slots (Fig. 3). When the electromagnetic force mode and eigenmode are the same it generates a large amount of vibration, so confirming the electromagnetic force mode is extremely important in terms of accurately discerning the vibratory force.
 Magnetic field analysis result
![]() Confirm FFT processing of electromagnetic force distribution
Confirm FFT processing of electromagnetic force distribution
 Electromagnetic force (DC component)
 Electromagnetic force (4th order component)
 Electromagnetic force (12th order component)
 Electromagnetic force (24th order component)
Fig. 3 Confirming the Electromagnetic Force Mode
Calculating the eigenmode value for a vibration noise analysis
Eigenmode analysis steps
Obtain an eigenfrequency and eigenmode in an eigenmode calculation. Motors are made up of many different parts, so decide on the modeling method from the aspect of individual parts. Once you have decided on a modeling method based on individual parts, assemble parts individually and then model them in a unified form (Fig. 4). Assembling individual parts and comparing the actually measured eigenfrequency and eigenmode with the analysis results to always confirm the suitability of the modeling method.
 Fig. 4 Steps in an Eigenfrequency Analysis
Magnetic steel sheet modeling
The stator core in particular needs to be examined among all individual parts. As the magnetic steel sheet in the stator core is laminated, modeling it with fidelity would require a model with an enormous number of elements. Anisotropic material properties can be set in JMAG, so softening the stiffness in the lamination thickness direction enables modeling of the lamination core in a single homogenized lump. Setting the Young's modulus of the lamination thickness direction at 20% to 50% of the Young's modulus in the in-plane direction enables modeling of a magnetic steel sheet as an anisotropic material. Modeling methods will differ if the magnetic steel sheets are welded or stuck together with adhesive. If the sheets are welded only on the exterior of the core, have a relatively low Young's modulus of around 30% and if all places are fixed into place as with an adhesive core, then make the setting around 50%.
Modeling the Rotor Area
This shows how to model the rotor area comprising the rotor core, magnet and shaft. It is believed that the rotor area eigenfrequency has only minimal impact on vibration noise, the object of this edition. However, the effect of the rotor's mass has an impact on the stator and stator exterior frame. The rotor core, then, is modeled on the mass point and shaft on beam elements to keep down the model size (Fig. 5).
 Fig. 5 Modeling the Rotor Area
Coil Modeling
This shows coil modeling methods. Here are the results of how much of an effect coil modeling methods can have on stator core deformation by creating the three type of models shown below (Fig. 6). They are all made up of a stator core, frame and coil.
- Modeling of all finite elements, including the coil end region
- No modeling of coil end, modeling of finite elements including only coils in the slots. In the coil end region, the mass point is modeled.
- The coil is not modeled with finite elements, but all mass points are modeled.
The total mass of the coils in models 1) through 3) is set so that they are all the same. Comparing the eigenfrequency when the frame is distorted into an ellipse shows it to be 1) 2143Hz, 2) 2118 Hz and 3) 2064Hz, to be almost unchanged. If the mass is the same as the coil, this result shows that different modeling methods for coils have only negligible effect on stator core or frame distortion. Arrange the coil mass with the actual machinery and model with mass distribution appropriate for actual machinery to ensure there is no effect on stator core distortion. Here we will use 1) Simplified model where the coil end is a ring, in which the coil distortion can be confirmed.
 Fig. 6 Examination of Coil Modeling Method
In models 1) through 3), the region differs in which coils are modelled with finite elements.
The regions modeled using finite elements are: 1) All 2) Only coils within the slot, or 3) None.
Stator Core and Frame Contact Modeling
This shows contact modeling with the stator core and frame. The method of contact modeling the core and frame may need changes depending on the interference, but there are many methods, such as joining them with springs. In this case, the frame is a simple ring shape with sufficient uniform pressure applied, so assuming it will not slide in the θ allows for sharing nodes between the stator core and frame (Fig. 7). Compare with the eigenfrequency of the actual machinery and adjust the material characteristics of the part. Young's modulus may need to be increased slightly due to the effect of the fit and the effect of the internal pressure in both the frame and stator core.
 Fig. 7 Model of the Stator Core, Coil and Frame
Contact Modeling of the Frame and Cover
This shows contact modeling with the frame and cover fixed in place with a screw. As the screw area in the space between the frame and cover is completely fixed, the model has only the screw area as a shared node point (Fig. 8). As the effect of friction in contact planes outside of this screw area is so negligible there are no constraints and it is free.
 Fig. 8 Contact Modeling of the Frame and Cover
The screw area circled red is the only shared nodal that is merged and others are free.
Vibration Noise Analysis
In a vibration/sound calculation, use electromagnetic force obtained from a magnetic field analysis and eigenmode obtained from an eigenmode calculation to calculate the vibration and the sound pressure on the face specified for evaluation. With many permanent magnet motors there is little electromagnetic force due to magnetic flux in the lamination direction and the generated magnetic field has periodicity in the rotating direction so conduct a 2D, partial model magnetic field analysis. Modeling methods, meanwhile, differ significantly with vibration analyses in such ways as modeling the motor exterior frame in a full model. Using electromagnetic force conditions from JMAG's structural model analysis function can be applied for mapping electromagnetic force in a vibration analysis where modeling methods are different.
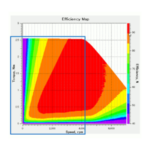
The result of the acceleration properties of the surface actually measured can be confirmed as having a resonance frequency of just over 3000Hz (Fig. 9). This shows the eigenmode of the resonance frequency confirmed through an analysis. We learned the cover shakes at about 2700Hz (Fig. 10). In this way we also learned that it's possible to find out in an eigenmode analysis the same finding achieved through actual measurements that frequency increases with acceleration. We hope this helps you to understand how to consider mechanical vibration countermeasures using analyses.
 Fig. 9 Frequency-No. of Rotations-Acceleration Properties
 Fig. 10 Eigenmode in Resonance Frequency (2679Hz)
Coupling with Other Software
We have described coupling using JMAG's structural analysis function, but if you already use other structural analysis software, it is also impossible to import electromagnetic force analysis results obtained from JMAG to conduct a vibration noise analysis.
Outputting electromagnetic force distribution in a file
When using another structural analysis software like Nastran, OptiStruct (from Altair) or ANSYS Mechanical (from ANSYS), output an electromagnetic force distribution file using JMAG's multi-purpose export tool function. Using this tool will output the electromagnetic force distribution in a Nastran, .csv or unv. file format.
With this tool, as with a structural analysis in JMAG, it becomes possible to output results obtained from a 2D partial model analysis in a 3D full model (Fig. 11). This shows a case study of a vibration analysis in Altair's OptiStruct using an electromagnetic force Nastran file output from JMAG (Fig. 12).
 Fig. 11 Mapping Electromagnetic Force
 Fig. 12 Vibration Analysis Results from Altair's OptiStruct
Coupling with LMS Virtual.Lab from LMS
Use JMAG-Designer's exclusive output tool to prepare for a vibration sound calculation using LMS Virtual.Lab from LMS. This tool will output electromagnetic force in a time sequence and is mapped in an analysis model in LMS VirtualLab. For that reason, even if the geometry changes such as through adding places where electromagnetic force is not generated for reasons such as the addition of reinforcing ribs on structural models, there is no need to return to JMAG-Designer for re-mapping. This shows the results of an acoustic analysis using LMS Virtual.Lab (Fig. 13).
 Fig. 13 Results of an Acoustic Analysis using LMS Virtual.Lab from LMS
Coupling with SIMULIA's Abaqus
When performing a vibration calculation using SIMULIA's Abaqus, it is possible to directly map electromagnetic force calculated by JMAG with an Abaqus input file.
This shows the results of acceleration distribution calculated in SIMULIA's Abaqus (Fig. 14).
 Fig. 14 Acceleration Results in SIMULIA's Abaqus
In Closing
This article refers only to a single case, but it was a description of modeling methods to gain an idea of how a motor's electromagnetic force and eigenfrequency create a resonance phenomenon. Electromagnetic force naturally needs countermeasures, being the vibratory force, but steps also need to be taken mechanically against vibration and these can be examined using JMAG. JMAG's structural analysis function enables geometry creation or condition specification using the same operations as for a magnetic field analysis. When examining a structural analysis as an extension of a magnetic field analysis, there is no need to learn any new operational procedures. Of course it's also possible to couple with other software formats that specialize in structural analyses and we plan to make it even more powerful moving forward.
For those who are currently using JMAG only for magnetic field analyses, why not give it a try with structural analyses? Our next edition is planned to be a look at modeling methods for evaluating harmonic frequency from PWM carrier frequency.
(Tetsuya Hattori)
[JMAG Newsletter January, 2014]