*Please prepare a license ID and password for the license administrator.
*It is different from the service for JMAG WEB MEMBER (free membership). Please be careful.
Overview
When comparing the distributions of multiple designs, it is difficult to check subtle differences simply by displaying the distributions side by side. JMAG can display the difference between two distributions resulting from running analyses (Fig. a). This document shows how to display the distribution difference contour plot using the result difference calculation function.
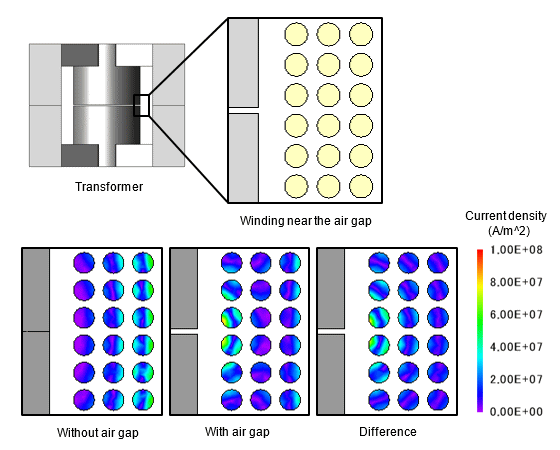 Fig. a Difference in winding current density distribution based on the presence/absence of an air gap
Key words
result difference calculation, difference, ratio, distribution display, counter plot, vector plot, flux line

