Contents
1. Introduction
2. The minor loop loss accuracy verification method
3. Comparing to actual measurements
4. Conclusion
5. References
1. Introduction
One of the important issues in magnetic field analysis is the improvement of loss analysis accuracy. Within this as well there are issues with iron loss analysis such as harmonic iron loss, minor loop loss, residual strain, and stress dependence. The issue with minor loop loss is that with conventional methods based on actual measurements the measurements are performed with alternating current and therefore it is not possible to accurately ascertain a minor loop with direct current superposition. Therefore, a play model that can accurately describe a minor loop for an arbitrary driving state is used for iron loss analysis [1]. Since this play model can reproduce a loop for an arbitrary operating point from a symmetrical loop group, theoretically minor loop loss can accurately be calculated.
In this paper, from the minor loop loss with DC superposition being measured and compared with results using the play model, it was verified that the play model can reproduce the minor loop loss actually measured.
2. The minor loop loss accuracy verification method
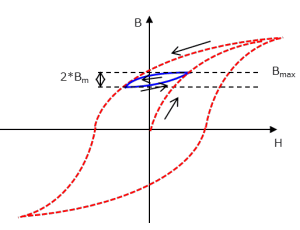
The measurement of minor loop loss was carried out while varying the magnetic flux density using direct current. The reason why minor loops were measured using direct current is to eliminate the influence of eddy currents. 35A360 was used for an electromagnetic steel sheet. The amplitude of the minor loop was set to 0.05, 0.1, and 0.4 T. The DC superposition component was measured from 0.2 to 1.8 T (Fig. 1).
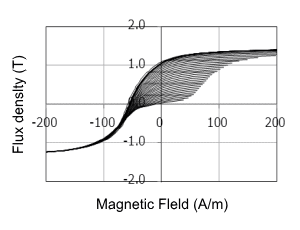
Hysteresis loss was calculated using the play model under the same conditions. The symmetric loop group used for the calculations consists of 36 loops varying in amplitude from 0.05 to 1.8 T in increments of 0.05 T. The measurements of the symmetric loop group were taken using alternating current. Fig. 2 shows the symmetric loop group measured.

Fig. 1 Minor loop loss measurement
Minor loop loss with amplitude Bm was measured while changing Bmax using direct current.

Fig. 2 Symmetric loop group for the play model
35A360 symmetric loop group. It consists of 36 loops with amplitudes in increments of 0.05 T, from 0.05 to 1.8 T.
3. Comparing to actual measurements
Fig. 3 shows the results from minor loops with amplitudes of 0.1 T. Two play model results are shown. One is the result from using the measured symmetric loop group, and the other is the result of using less loops and incrementing in 0.1 T steps.
You need to sign in as a Regular JMAG Software User (paid user) or JMAG WEB MEMBER (free membership).
By registering as a JMAG WEB MEMBER, you can browse technical materials and other member-only contents for free.
If you are not registered, click the “Create an Account” button.
Create an Account Sign in


