DC-DC converters such as flyback converters control current of primary / secondary winding with switch operation, and transmit electrical power on the load side using diodes and condensers. Depending on its application, there is a need to satisfy current voltage characteristics but it is affected by magnetic saturation and skin effect. To accurately evaluate current voltage characteristics, it will be important to specifically account for the impact of skin effects and proximity effects, as well as leakage flux from the core gap. Especially for high switching frequencies, it will be necessary to control alternating resistance occurring in the winding due to switch period, and to accurately evaluate alternating resistance to design converters with low loss.
Magnetic field analysis using the finite element method is effective for accurate analyses of magnetic saturation and alternating resistance. By coupling external circuits and magnetic field analysis running switching, the current voltage characteristics of the converter can be obtained.
In this example, this case study obtains the current waveform of the primary / secondary winding and the core magnetic flux density distribution, current density distribution inside the winding, joule loss density distribution at each time when the voltage is applied.
Current Waveform, Magnetic Flux Density Distribution
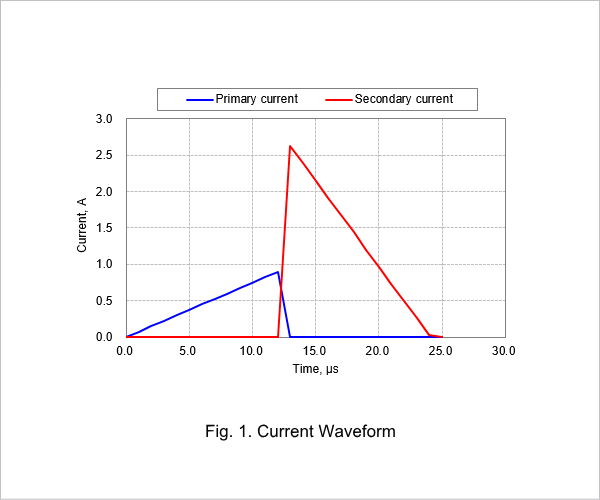
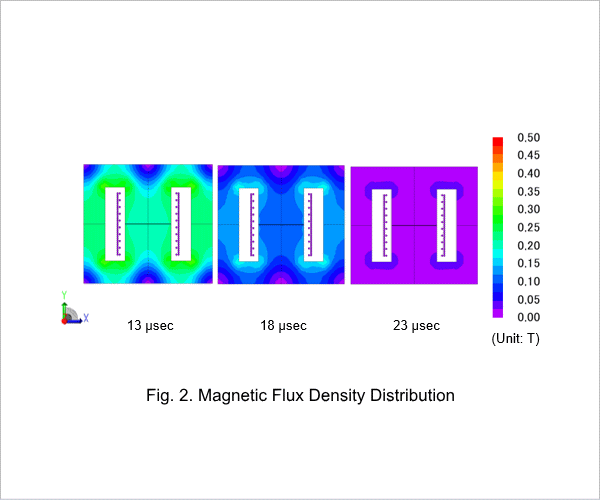
Primary current and secondary current waveform obtained in the time of one cycle in the steady state is shown in Fig. 1, and the magnetic flux density distribution of each time is shown in Fig. 2. While voltage is applied to the primary side when the switch is on, it can be confirmed that primary current is increasing. It can be confirmed that when the switch is off at 12.5 μs, the current of the primary side will be 0 and that current is flowing in the secondary side. The magnetic energy in the core accumulated by flowing current can be assumed by the magnetic flux density distribution on Fig. 2. Switching to the secondary side at 13 μs, it can be confirmed that the core magnetic flux density hits the maximum, and it is slowly discharged, reducing the magnetic flux density.
Voltage Characteristics
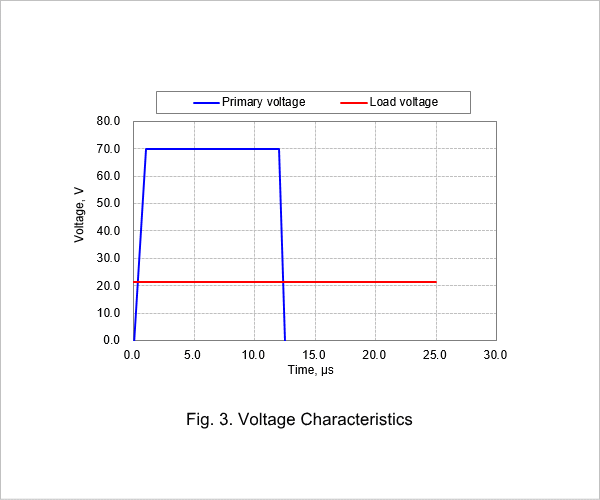
Primary coil terminal voltage and load voltage waveform obtained in the time of one cycle in the steady state is shown in Fig. 3. It can be confirmed that while the switch is on, the input voltage of 70 V is applied to the coil. It can be confirmed that the load voltage is a constant value of 21 V and has stepped down following the winding ratio.
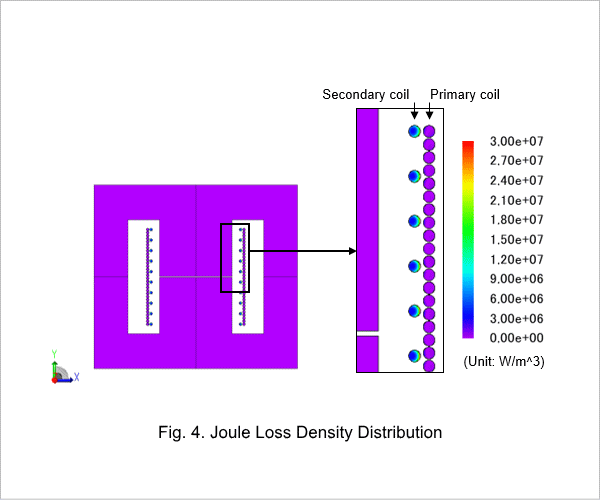
Joule Loss Density Distribution
The joule loss density when current is applied to the secondary winding is displayed in Fig. 4. The Fig. 4 shows that joule loss inside secondary winding is concentrated on the outside of the winding. This may be caused by the skin effect due to current variations inside the winding and leakage flux from the core gap.