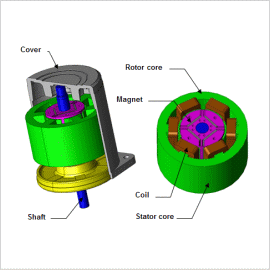
[JAC018] Thermal Analysis of a Motor

Sign in to download the data

Sign In

*Please prepare a license ID and password for the license administrator.
*It is different from the service for JMAG WEB MEMBER (free membership). Please be careful.
About authentication ID for JMAG website

Overview

Thermal Analysis of a Motor
Exactly how to resolve the problem of rising temperatures is a critical issue when trying to achieve an improvement in a motor’s efficiency and output. In order to solve this problem it is important to investigate a magnetic design that reduces the losses themselves because they are a source of heat, but it is also important to study a thermal design that improves heat dissipation and does not let the temperature rise. Copper loss in the coils and iron loss in the core are the dominant heat sources, so this analysis mainly evaluates the effects of this heat. Changes in the magnet’s properties due to temperature are large and its heat resistance is low, so it is necessary to design while paying careful attention to rising temperatures during operation. During operation, rated evaluations with a continuously operated constant load are run until a thermal balanced state has been reached. In addition to these rated evaluations, however, thermal transient evaluations that add a thermal cycle with an intermittently operated electrical overload are performed, as well.
In order to carry out an accurate thermal design, it is necessary to first correctly understand the heat generation amount and location, so it would be advantageous to calculate the losses in a magnetic field analysis simulation using the finite element method, and from there to carry out a thermal analysis using the resulting loss distribution.
In this example, how to evaluate a motor’s temperature distribution by creating a thermal analysis model that can investigate the loss analysis and temperature distribution in order to obtain the motor’s total loss distribution, and then analyzing the elevated temperature process.

Loss
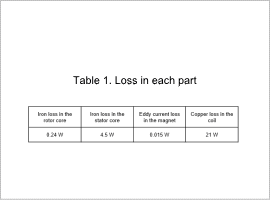
Table 1. Loss in Each Part
The values of the losses in each part when a 2 A current is applied are shown in Table 1.
The loss in the coil is relatively large, and it is expected to be the main source of heat.

Temperature Distribution at Steady State
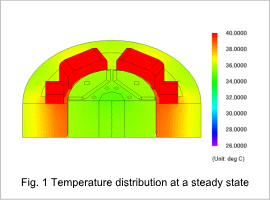
Fig.1. Temperature Distribution at a Steady State
The distribution of temperature at the steady state when a 2 A current is applied is shown in Fig. 1.
The result shows that the temperature is transferred from the coil to the surrounding parts.

Temperature Variation

The points where the temperature is measured in each part and the temperature changes when a 2 A current is applied are shown in Fig. 2 and Fig. 3.
Fig. 3 shows that the temperature in each part reaches a steady state.
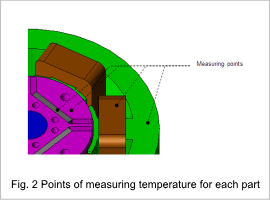
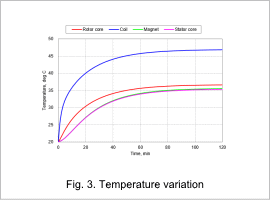
Fig.2. Points of Measuring Temperature for Each Part
Fig.3. Temperature variation

Consecutive Operating Time and Average Torque with Various Currents

The current was set at three times the rated value to increase the average torque to 1.0 Nm or above. The average torque and temperature variations in the coil are shown in Table 2 and Fig. 4 (see Fig. 2 for the points of measurement).
Although increasing the current produces a higher torque, at a motor drive time of 20 min the coil’s temperature exceeds the upper temperature limit of 180 deg C.
By carrying out a magnetic field-thermal coupled analysis in this way, it is possible to evaluate the motor’s properties and constraints with more detail.
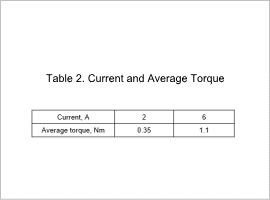
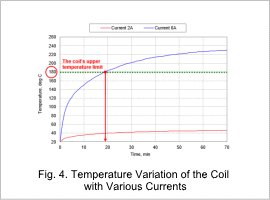
Table 2. Current and Average Torque
Fig.4. Temperature Variation of the Coil with Various Currents

Search Filter

  • All Categories