*Please prepare a license ID and password for the license administrator.
*It is different from the service for JMAG WEB MEMBER (free membership). Please be careful.
Overview
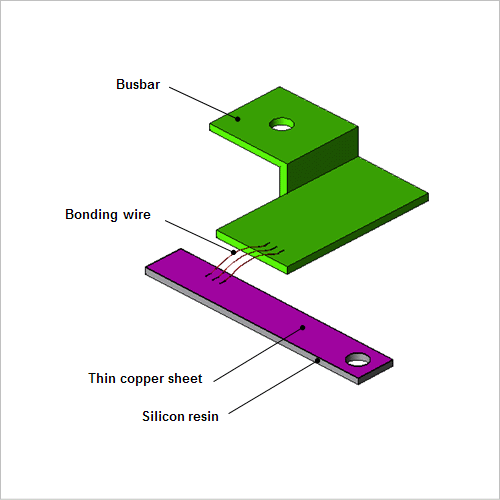
Current is supplied via bus bars or wire bonding in power supply lines for power electronics devices such as inverters. Because inverters and similar devices operate with PWM carrier frequencies of several kHz, high-frequency current flows in their bus bars. Influences from the skin effect cannot be ignored in this kind of high-frequency current, so increased resistance and loss become problems.Furthermore, when thermal strain is caused due to excessive heat generation, disconnections may occur in a worse case scenario of stress accumulating in the bonding wire connection region. This type of stress is called thermal stress. When thermal stress exceeds yield stress, irreversible changes to geometry occur, so verifying thermal stress distribution due to heat generation is important.
Because a bus bar's geometry is complicated, it is difficult to predict in advance where there will be unevenness in the current's flow while current is running, and whether this will cause heat generation. With magnetic field analysis using the Finite Element Method (FEM), it is possible to correctly obtain the unevenness in current distribution and the joule loss, and then predict the temperature distribution with these as causes of heat generation.
Here, temperature distributions for bus bars are obtained when the power supply frequency is changed.
Electric field distribution
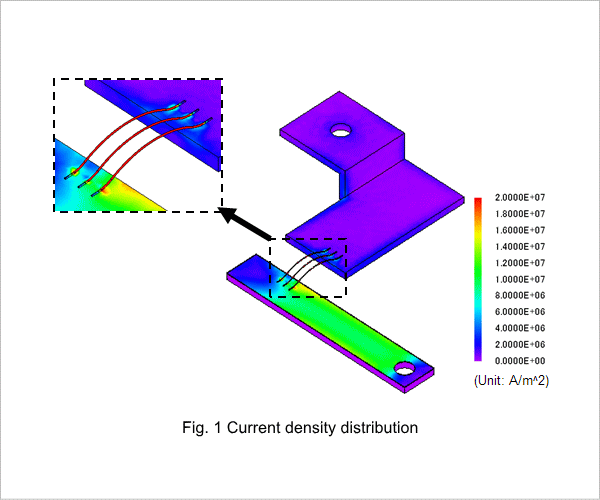
Fig.1 shows current density distribution. Distribution is occurring in current density for the bus bar and thin copper sheet due to the skin effect as indicated in Fig.1. As the section of the bonding wire where current flows is small, it is clear that current density is particularly getting higher, when compared to others.
Temperature Distribution
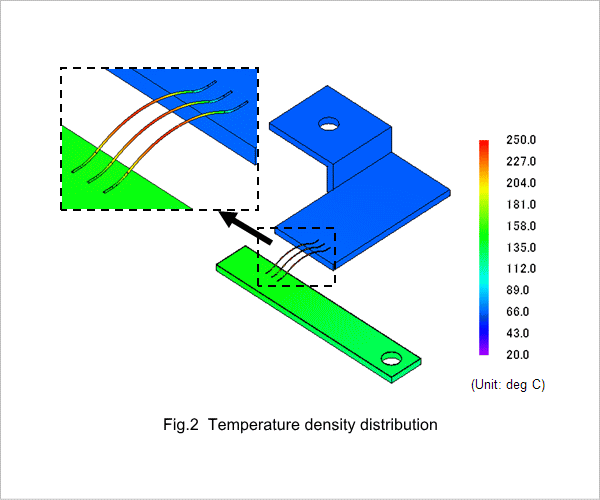
The temperature distribution of the bus bar is shown in Fig.2. Temperature is rising with the bonding wire and the copper thin sheets. The temperature of the bonding wire has increased especially at over 200 deg C.
Thermal Stress Distribution
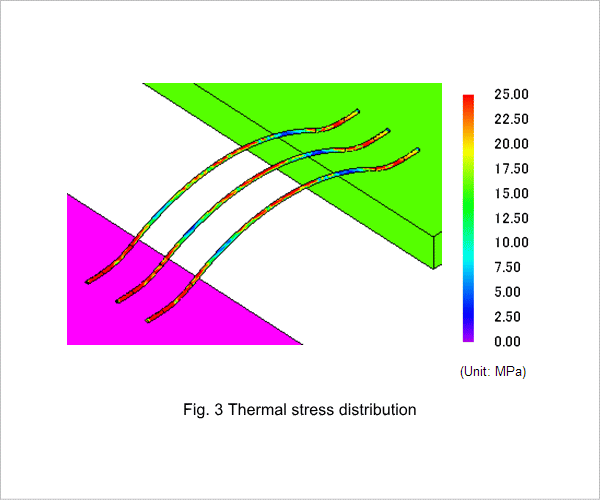
Fig.3 shows thermal stress distribution of the bonding wire. There is distribution in thermal stress, and it also shows that large stress is put on the connection joint between the bus bar and the copper thin sheet, as well as the top of the bending part. Caution needs to be taken because temperature increase will not only cause burn out, but it may also damage the wire due to local thermal stress.

