*Please prepare a license ID and password for the license administrator.
*It is different from the service for JMAG WEB MEMBER (free membership). Please be careful.
Overview
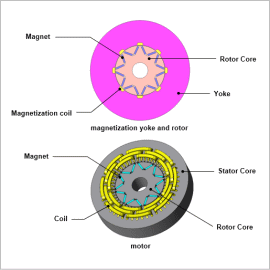
It is important to solve the problem of temperature rise in order to achieve high motor efficiency and high output. Magnets are used in motors and display large variation in their properties verse temperature. For rare earth magnets at temperatures over hundred degrees demagnetization can occur. Since the presence or absence and degree of demagnetization are determined by a combination of the demagnetizing field and the temperature applied, it is necessary to pay attention to magnetic circuit design in addition to the heat resistance of magnets themselves. In particular, since it is easier for demagnetization to occur at locations where the coercive force is not sufficient due to incomplete magnetization, it is desirable to at the same time evaluate the coercive force distribution of magnets.
Using magnetic field analysis simulation that uses finite element method analysis, it is possible to evaluate motor characteristics at high temperatures and high loads by taking into account the thermal demagnetization characteristics verse coercive force distribution values obtained from magnetization analysis.
In this example, analysis is performed while varying the temperature of magnetized magnets, and then the influence on the torque waveform and magnetic flux density distribution is evaluated.
Magnetizable Material with Thermal Demagnetization Information
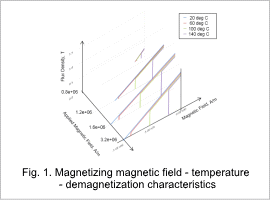
Since demagnetization characteristics after magnetization also depend on temperature, a characteristic table was prepared verse several different temperatures where the temperature is for after magnetization from an magnetizing magnetic field. This table was created for magnetizing magnetic field, temperature, and demagnetization characteristics (Fig. 1).
When used as magnet material after magnetization, a table of temperature – demagnetization characteristics verse magnetizing magnetic field at the time of magnetization is referenced. Since the magnetizing magnetic field is not uniform inside the magnet, the demagnetization characteristics vary in the magnet.
When used as magnet material after magnetization, a table of temperature – demagnetization characteristics verse magnetizing magnetic field at the time of magnetization is referenced. Since the magnetizing magnetic field is not uniform inside the magnet, the demagnetization characteristics vary in the magnet.
Magnetic Field Distribution After Magnetization
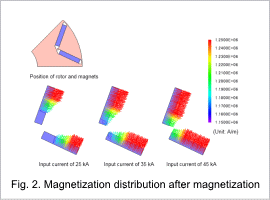
Fig. 2 shows the magnetic field distribution of two magnets magnetized in place (in the rotor core) at input currents of 25 kA, 35 kA, and 45 kA. As the input current becomes larger the portion of the magnets near the bridge, which is least magnetized, becomes more magnetized. Where magnetization is low the magnetization is insufficient.
Induced Voltage Waveform
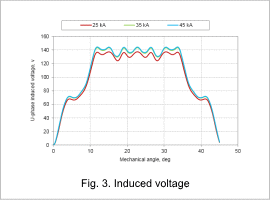
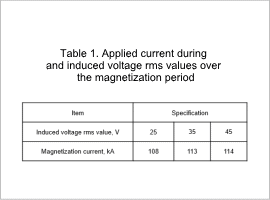
Fig. 3 shows the U-phase induced voltage waveform when the magnets are magnetized in place with an input current of 25 kA, 35 kA, and 45 kA. The rms value of the induced voltage over this time is shown in Table 1. From an evaluation of only the induced voltages it can be confirmed that there is a difference of about 5 % between the 25 kA case and the other cases.
Change in Torque Due to Thermal Demagnetization
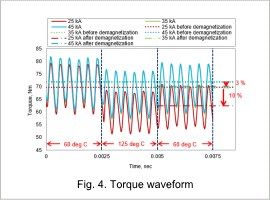
Using magnetized magnets in place for input currents of 25 kA, 35 kA, and 45 kA the torque waveforms are shown in Fig. 4 for when the magnet temperature changes from 60 to 125 deg C at the first 1/2 electrical angle period (mechanical angle of 45 deg) and from 125 to 60 deg C at the second 1/2 electrical angle period.
From Fig. 4, it can be seen that the average torque decreases due to thermal demagnetization when the magnets are heated to 125 deg C. In addition, even if returned to 60 deg C, since the average torque decreases by 3 to 10 % compared to with before the temperature increase, it can be seen that irreversible demagnetization occurred during the temperature rise. Furthermore, it can be confirmed that the degree of deterioration of torque characteristics due to demagnetization is dependent on the input current during magnetization.
From Fig. 4, it can be seen that the average torque decreases due to thermal demagnetization when the magnets are heated to 125 deg C. In addition, even if returned to 60 deg C, since the average torque decreases by 3 to 10 % compared to with before the temperature increase, it can be seen that irreversible demagnetization occurred during the temperature rise. Furthermore, it can be confirmed that the degree of deterioration of torque characteristics due to demagnetization is dependent on the input current during magnetization.
Demagnetization Ratio Distribution
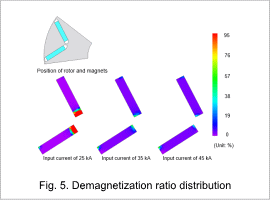
Fig. 5 shows the demagnetization ratio distribution when the temperature is returned to 60 deg C referenced to the magnetization state before the temperature rise. The demagnetization shown here is irreversible demagnetization caused by exceeding the knee point, which is an indicator of the deterioration of the magnet characteristics.
From the figure, even if returned to 60 deg C, significant demagnetization appears over a wider region than before the temperature rise. Moreover, when the input current during magnetization is small, it can be confirmed that large demagnetization occurs near the bridge.
From the figure, even if returned to 60 deg C, significant demagnetization appears over a wider region than before the temperature rise. Moreover, when the input current during magnetization is small, it can be confirmed that large demagnetization occurs near the bridge.


