*Please prepare a license ID and password for the license administrator.
*It is different from the service for JMAG WEB MEMBER (free membership). Please be careful.
Overview
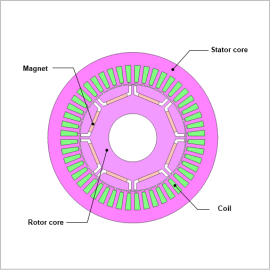
EV/HEV traction motors are evaluated for energy consumption, etc., by using drive cycles. When a motor is driven at operating points during drive cycles, part temperatures rise with the loss as a heat source, thereby increasing the loss even further. Evaluations should therefore account for this increase in loss during the drive cycles.
By using loss maps with temperature dependency, evaluations can account for the increase in loss that occurs due to the rise in temperature of the winding coils and magnets during the drive cycles.
In this example, loss maps with temperature dependency for an IPM motor are used to compare and evaluate the energy consumption and efficiency during a WLTC drive cycle while using air cooling and a cooling jacket.
Maps Before and After Rise in Temperature
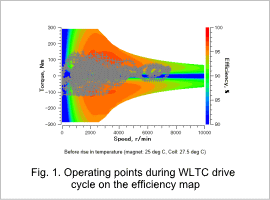
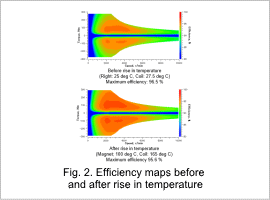
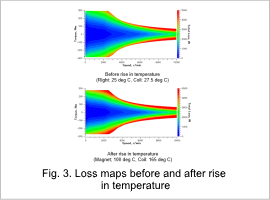
Fig. 1 shows the motor operating points during the WLTC drive cycle on the efficiency map, Fig. 2 shows the efficiency maps both before and after the rise in temperature, and Fig. 3 shows the loss maps.
From Fig. 1, it can be seen that the motor operating points during the WLTC drive cycle include high-efficiency regions.
From Fig. 2 and Fig. 3, it can be seen that the maximum efficiency reduces by approximately 1 point due to the increase in part temperature. The main cause is the increase in copper loss that occurs due to the decrease in electrical conductivity, which is caused by the increase in coil temperature.
Energy Consumption and Efficiency During Drive Cycle Due to Different Cooling
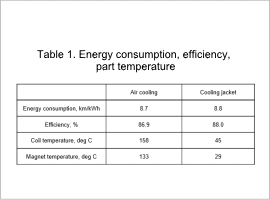
Using the loss map with temperature dependency, Table 1 shows the energy consumption, efficiency, and part temperature when the motor is cooled during the WLTC drive cycle with either air cooling or a cooling jacket.
When using a cooling jacket, it can be seen that there is an improvement of 0.1 km/kWh in energy consumption and 1.1 in efficiency compared to air cooling.
It can be seen that the coil temperature is 113 deg C lower when using a cooling jacket compared to air cooling. This reduces the copper loss, thereby improving the energy consumption and efficiency.


