Overview
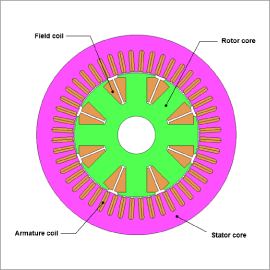
Optimizations using simulations can automatically explore numerous design ideas in a large design space to obtain optimal design proposals. The templates provided by JMAG-Express make it simple and easy for users to create motor models, run optimizations, and evaluate design ideas. Users can combine various JMAG-Express scenarios to run optimizations that take into account the magnetic fields, temperatures, and stress all at the same time.
This case study runs a parametric optimization of a main automotive engine to maximize efficiency and torque while minimizing the temperature and stress as constraint conditions.
Cooling Specifications, Design Requirements, Design Variables, and Optimization Objectives
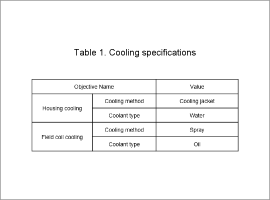
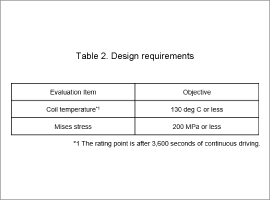
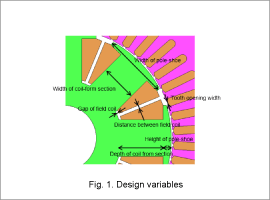
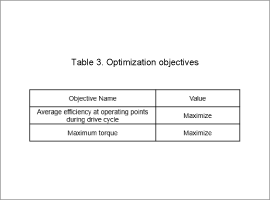
Table 1 outlines the cooling specifications. Table 2 provides the design requirements. Fig. 1 illustrates the design variables. Table 3 outlines the optimization objectives.
Initial Design
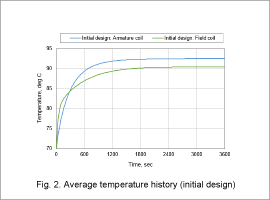
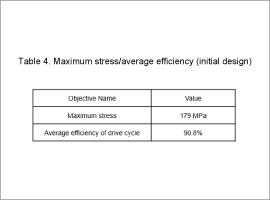
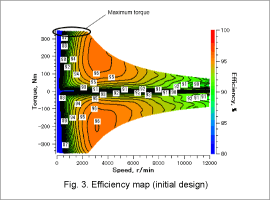
Fig. 2 presents the average temperature history of the coil for the initial design before running the optimization. Table 4 outlines the maximum stress values and average efficiency of the drive cycle. Fig. 3 shows the efficiency map.
Fig. 2 and Table 4 indicate a maximum stress of 200 MPa or less and an average temperature of 130 deg C or less in both the armature and field coils, which satisfies the motor requirements.
As illustrated by Fig. 3 and Table 4, the maximum torque in the initial design is 350 Nm with an average efficiency of 90.8% for the drive cycle.
Optimization Results
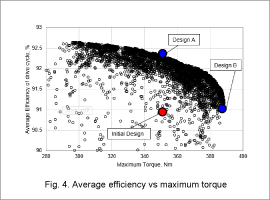
Fig. 4 confirms the optimized designs have better average efficiency and maximum torque than the initial design. This document extracts and examines the geometry and results for Design A, which has almost the equivalent maximum torque as the initial design but offers better efficiency, and Design B, which has the highest torque.
Design Comparison
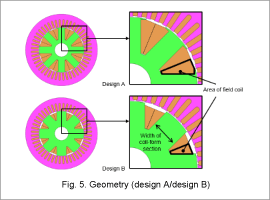
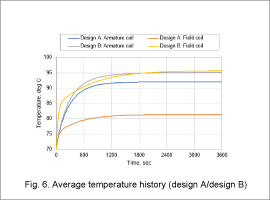
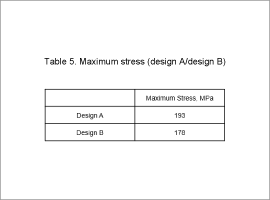
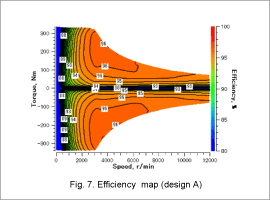
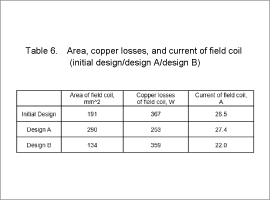
Fig. 5 and Fig. 6 show the geometry and present the average temperature history of each part while Table 5 outlines the maximum stress for Design A and Design B. Fig. 7 provides an efficiency map for Design A. Table 6 compares the area, copper losses, and current values of the field coil for the initial design, Design A, and Design B.
As illustrated by Fig. 6 and Table 5, Design A and Design B both have a maximum stress of 200 MPa or less with an average armature and field coil temperature of 130 deg C or less, which satisfy the motor requirements.
As illustrated by Fig. 7, Design A has a larger high efficiency region than the initial design. This is because the field coil has more area that accommodates a wire with a larger diameter, which reduces the copper losses as presented in Fig. 5 and Table 6.
The width of the coil-form section indicated in Fig. 5 increases from 22.5 mm in the initial design to 28.0 mm in Design B, which seems to increase the torque by raising the amount of magnetic flux that can pass through the coil-form section. Moreover, Design B presented in Fig. 5 and Table 6 has a field coil with less area than the initial design. This decreases the wire diameter, but the copper losses still drop because the smaller diameter restricts the current flowing in the field coil. Moreover, Design B also decreases the area of the field coil, which does reduce the copper losses but also results in higher temperatures than the initial design.
