*Please prepare a license ID and password for the license administrator.
*It is different from the service for JMAG WEB MEMBER (free membership). Please be careful.
Overview

The laminated structure of a core in a SPM motor can be sustained using press-fitting or shrink fitting. The press-fitting stress needs to be accounted for in the iron loss evaluation because the stress caused by press-fitting is known to increase the iron losses when a magnetic steel sheet is used for the core of the motor.
An iron loss is generated by the magnetization field in displacement with a steel sheet. The size of the iron loss is dependent on the iron loss properties of a steel sheet. The iron loss characteristics of a steel sheet deteriorates by stress from press fit coupling. The stress generated by the press fit coupling is distributed in areas in which the section in the back yoke becomes large. In order to evaluate the iron loss with good accuracy, it is necessary to obtain the stress distribution for the magnetic flux, time variation, and steel sheet with accuracy.
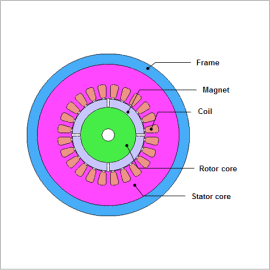
This note presents the use of the press fit condition to model a core and frame and obtains iron loss density for when the generated stress is used and not used.
Compressive Stress Distribution
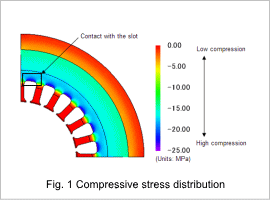
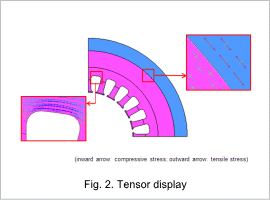
The compressive force distribution is indicated in fig. 1, and the tensor display is indicated in fig. 2. The compression stress is large in the yoke when compared to the frame and teeth. The compression stress is concentrated in the yoke facing the slots because the stress decreases towards the tip of the teeth while the stress in the slots does not decrease. The compression stress is concentrated around the slots, and the tensile strength is concentrated around the frame as indicated in fig. 2.


Iron Loss Density Distribution

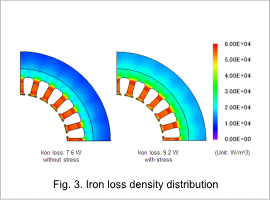
The iron loss density distribution is indicated in fig. 3. The iron loss density distribution varies depending on whether or not the stress is applied. The iron losses are increased by 15 % due to the stress. An analysis that accounts for the compressive stress caused by the press-fitting needs to be performed to evaluate the iron losses more accurately because the iron losses increase when the compressive stress is applied.


