Overview
Simulations that use temperature-dependent efficiency maps can evaluate the rise in losses as the temperature of the coil increases during the drive cycle. Users can configure a thermal circuit to create a cooling model by using a wide range of components, including cooling jackets that account for temperature variations of the coolant and spray shaft cooling.
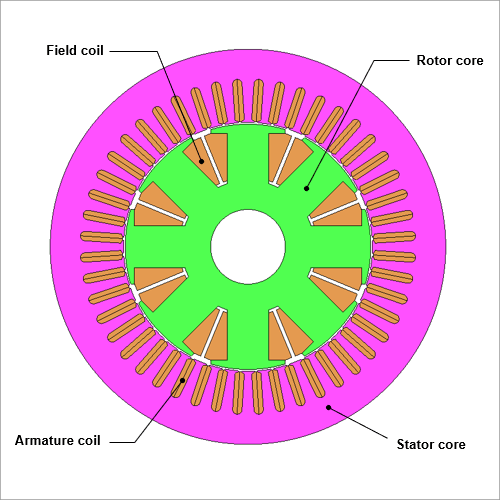
This case study evaluates the losses and temperature changes over time of a wound-field synchronous motor during a WLTC drive cycle using temperature-dependent efficiency maps.
Analysis Flow
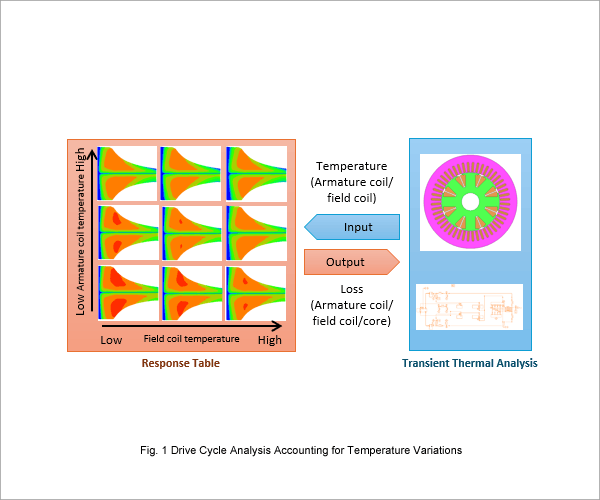
The magnetic field analysis study (efficiency map analysis) generates multiple efficiency maps that include the loss data for the various temperature combinations of the armature and field coils.
The thermal analysis extracts the heat generation of each part from the efficiency map to obtain the temperatures at the current step based on the operating points during the drive cycle and the temperatures from the previous step.
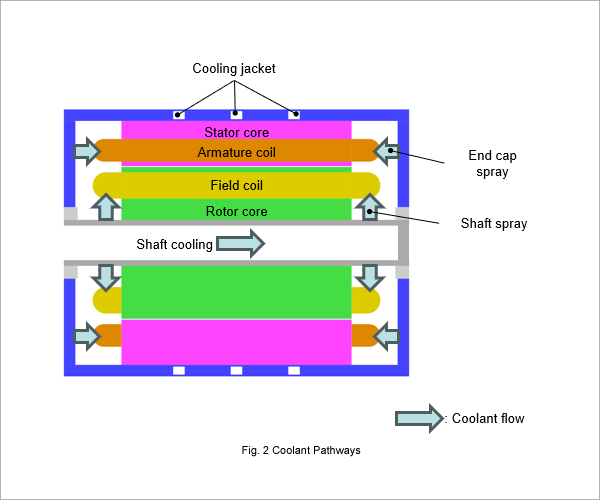
Coolant Pathways
Losses Before/After Temperature Rise
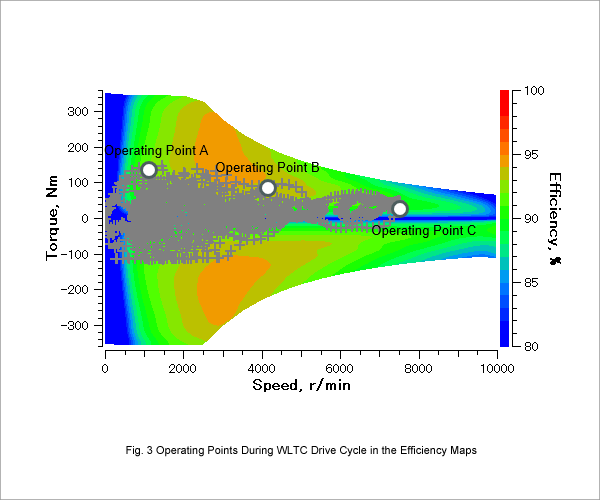
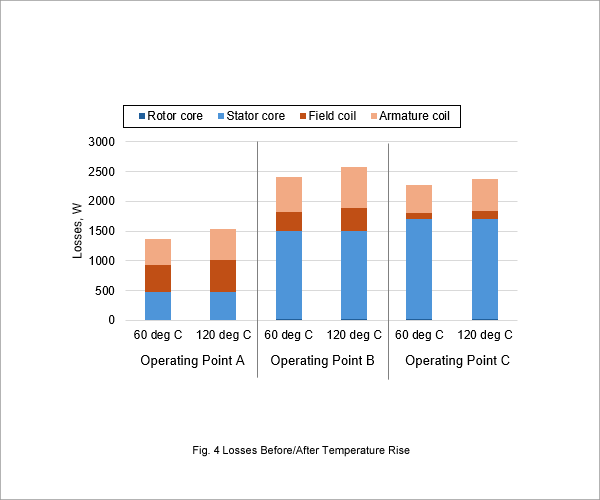
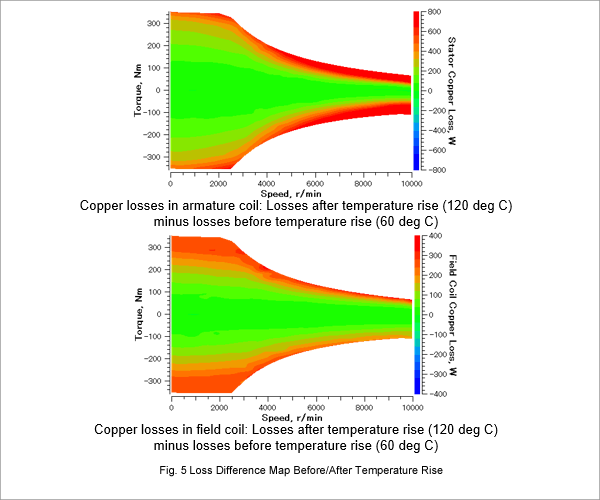
Fig. 3 indicates the motor operating points in the efficiency map during the WLTC drive cycle. Fig. 4 presents the losses before and after the temperature rise at those three operating points. Fig. 5 provides loss difference maps.
The operating points of the motor during the WLTC drive cycle expand over a broad area as seen in Fig. 3.
The losses increase as the part temperatures rise as illustrated by Fig. 4.
The loss difference maps in Fig. 5 also show the losses increasing as the part temperatures rise. Higher resistance due to the rising coil temperatures drives up the copper losses in the armature and field coils. A drive cycle analysis must account for this phenomenon because the temperature rise in each part influences the losses.
Drive Cycle Analysis Accounting for Temperature Variations
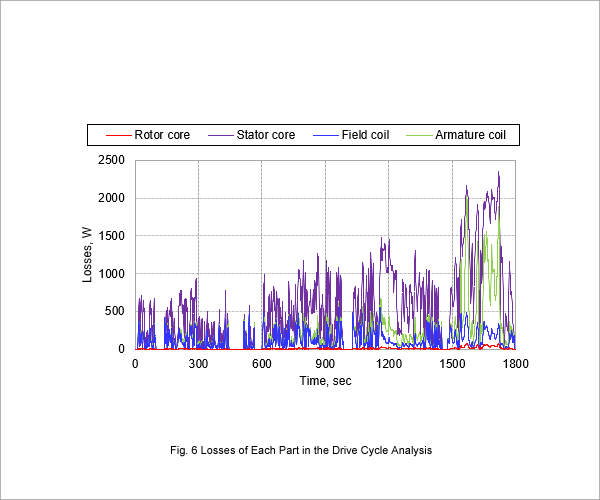
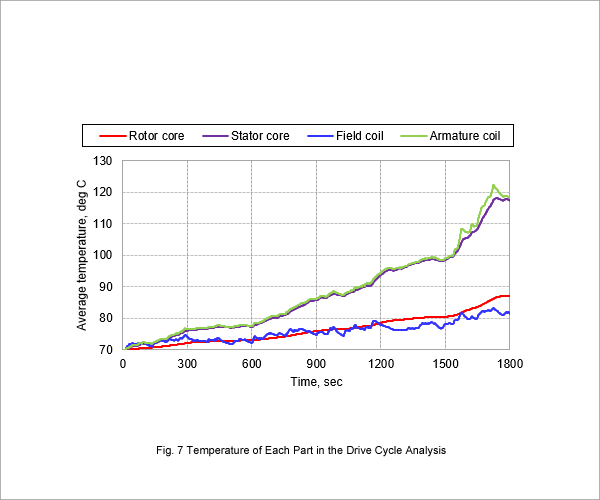
This case study ran a WLTC drive cycle analysis accounting for temperature variations in the armature and field coils. Fig. 5 illustrates the losses in each part over time. Fig. 6 presents the temperature variations over time.
The losses in the stator core and armature coil are high as indicated in Fig. 6.
The temperatures of the stator core and armature coil that have significant losses are not only high but change quickly as illustrated in Fig. 7.