Overview
Simulations that use temperature-dependent efficiency maps can account for the interaction between the magnetic field and thermal characteristics. Efficiency maps created based on these results more closely approximating the actual machine for the short-time rating. JMAG can configure thermal circuits that use a variety of cooling models. This includes a cooling jacket component that accounts for temperature variations of the coolant as well as components to combine hollow shaft and spray cooling.
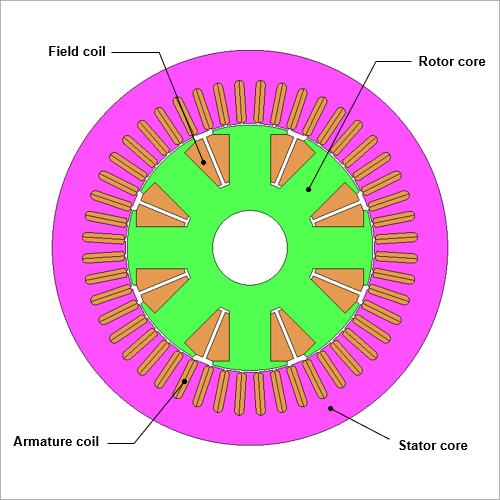
This case study runs various wound-field synchronous motor analyses to create efficiency maps by applying a temperature limit for motor components during continuous and short-time operation.
Analysis Flow
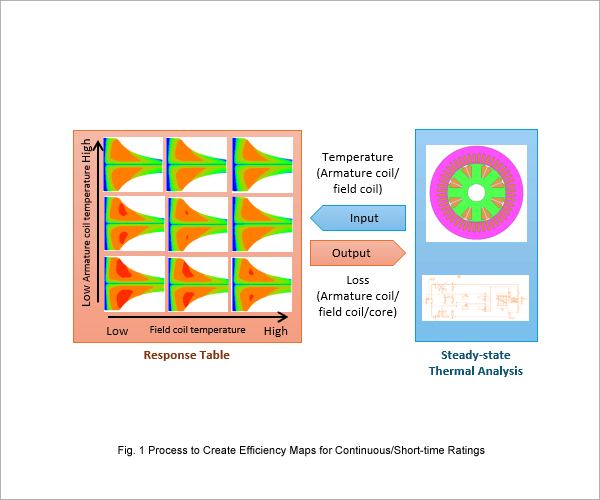
The magnetic field analysis study (efficiency map analysis) generates multiple efficiency maps that include the loss data for the various temperature combinations of the armature and field coils.
Next, the thermal analysis study (continuous operation characteristics analysis) runs steady-state thermal analyses by assigning operating points according to the efficiency maps obtained by the magnetic field analysis (efficiency map analysis). The simulation runs multiple steady-state thermal analyses at each operating point to integrate the temperature dependency of heat sources in each part obtained in the magnetic field analysis (efficiency map analysis) with the steady-state temperatures obtained by each thermal analysis. This process obtains efficiency maps that include the current, loss, and various other characteristics that account for continuous operation. Moreover, the temperature limits set for the efficiency maps exclude any operating points that exceed the temperature limit to obtain only N-T curves and efficiency maps during continuous operation that fall within these temperature constraints.
The same procedure can also create efficiency maps for the short-time rating. However, the thermal simulation runs a short-time operation characteristics analysis and transient thermal analyses for the length of the drive cycle at each operating point.
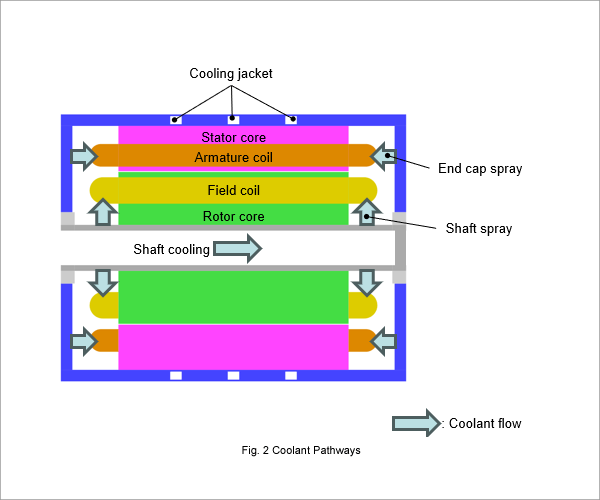
Coolant Pathways
Comparison of Characteristics for Coils at a Constant 60 deg C versus Continuous and Short-time Ratings
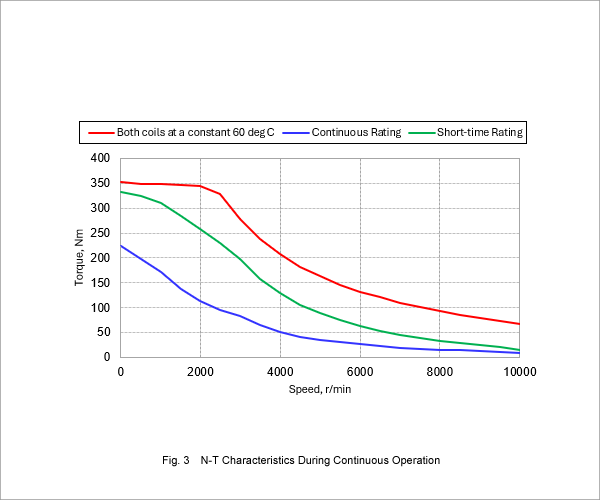
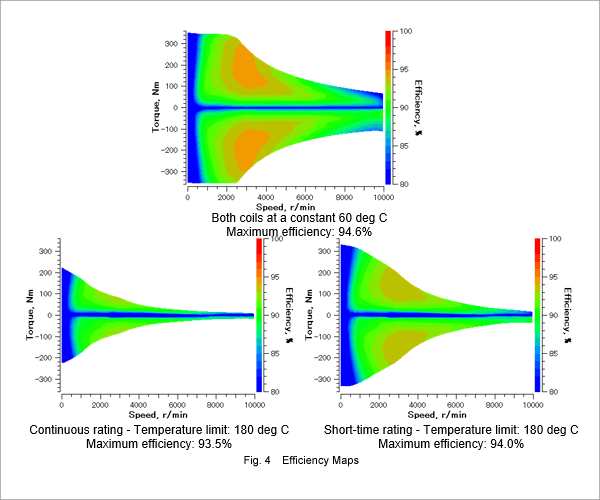
Fig. 3 compares the N-T curves for armature and field coils at 60 deg C versus the N-T curves of continuous/short-time ratings that account for temperature limits. Fig. 4 presents the efficiency maps. The continuous/short-time ratings set a temperature limit of 180 deg C for each coil. The drive time for the short-time rating is 900 seconds in this case study.
As the N-T curves illustrate in Fig. 3, the motor with coils at a fixed temperature of 60 deg has the highest torque followed by the short-time operation and continuous operation due to a decline in torque as the temperature rises in each coil and the influence temperature limits have on the N-T characteristics.
As the efficiency maps indicate in Fig. 4, the maximum efficiency for the continuous rating is about 1.1 points less than the motor with coils at a fixed temperature of 60 deg C, while the short-time rating is roughly 0.6 points lower.