Contents
1. Introduction
2. Proposed method
2.1 Optimization of the range of dimensions
2.2 Predictive model
2.3 Performance
3. Application on IPM with 30 geometric parameters
4. Summary
1. Introduction
Genetic Algorithm (GA) based optimization with finite element analysis is expected to become a solution for high performance motor designs which need to satisfy many strict requirements. However, as its use goes towards complex design which has many geometric design parameters, the technique becomes difficult to use. The problem comes from the fact that the geometric design parameters move independently in given ranges so there is always a possibility of them conflicting with each other and resulting in geometry corruptions as illustrated in Fig. 1. The possibility goes up rapidly as the number of geometric design parameters increases as the survey of the success rate of multiple models demonstrates in Fig. 2. The geometry conflicts then prevent generating an appropriate population at the initial stage of the GA optimization. To overcome this, a technique which consists of the optimization of parameter ranges and a predicted model using machine learning was developed. The proposed technique was applied to an optimization problem of a PMSM with over 30 geometric design parameters confirming that the initial population was appropriately generated and the optimization can be performed successfully.
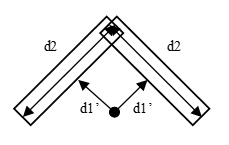 Fig. 1 Geometry Conflict
Two geometric design parameters d1' and d2 are specified separately. When d1' is short and d2 is large, two rectangle regions collapse. To avoid the conflict, it requires setting d1' and d2 appropriately. When the number of geometric design parameters is large, setting all parameters becomes difficult.
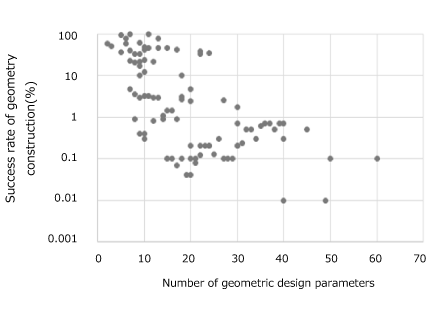 Fig. 2 Success rate of geometry construction versus the number of geometric design parameters
When the number of geometric design parameters is larger than 30, the success ratio of geometry construction by the brute force method, which generates individuals by ignoring conflicts until the number of individuals reaches the required initial population size, is less than 1%.
2. Proposed method
The proposed method is separated into two parts, the first is the optimization of the range of dimensions to update the geometric parameter range and the second is the use of the predictive model to obtain the required number of individuals in a short period of time.
2.1 Optimization of the range of dimensions
Optimization of the range of dimensions uses a GA algorithm for the optimization problem that has maximization of the geometric parameter range as an objective function while minimizing the geometric conflicts. This will result in ranges that will provide a higher success rate for changing geometries without drastically reducing the design space.
2.2 Predictive model
For further improvement, a machine learning based predicted model is introduced. The predicted model outputs whether there is a conflict in the geometry for a given set of geometric design parameters. Using this, the selection of only successful cases can be performed in shorter time than constructing actual geometry models. The predicted model requires the construction of an actual geometry model, and its accuracy depends on the amount of learning data. However, the total time for geometry construction using the predicted model including the learning time is shorter than the brute force method.
2.3 Performance
The proposed technique will provide a better success rate in the creation of the first generation for GA optimization. The improvement provided by this method increases with the number of geometric parameters shown in Fig. 3. The proposed technique maintains a high success rate and greatly reduces the generation time for the initial generation. The effect becomes significant as the number of parameters increases as shown in Fig. 4.
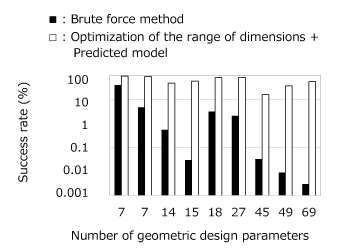 Fig. 3 Success rate of geometry construction by different combinations of methods
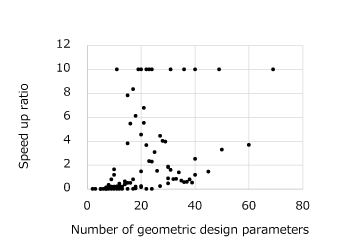
Fig. 4 Speed up ratio by using the optimization of the range of dimensions and the prediction model
The reference is the time by using the brute force method. Points having a ratio of more than 10 are plotted on the line of 10 times.
You need to sign in as a Regular JMAG Software User (paid user) or JMAG WEB MEMBER (free membership).
By registering as a JMAG WEB MEMBER, you can browse technical materials and other member-only contents for free.
If you are not registered, click the “Create an Account” button.
Create an Account Sign in