*Please prepare a license ID and password for the license administrator.
*It is different from the service for JMAG WEB MEMBER (free membership). Please be careful.
Overview

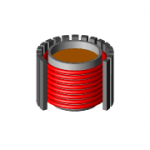
Reactors are used in all sorts of systems related to power systems. For example, they fill the role of making the current pulsation between an inverter and a motor smoother. Reactor vibration noise can also be an issue and countermeasures are sought from analysis.
Among target reactors, vibration is not generated solely by electromagnetic force but also by magnetostrictive force caused by magnetostriction. To evaluate this phenomenon with decent accuracy requires an accurate grasp of resonance phenomena with an eigenfrequency by adding both electromagnetic force and magnetostrictive force to the vibratory force.
These notes will conduct an analysis of changed vibratory force and show a case study of confirming the impact magnetostriction has on vibration noise.
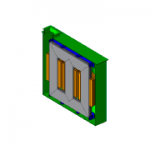
Electromagnetic Force Distribution

Fig. 1 shows the distribution of the electromagnetic forces. It is apparent that the electromagnetic force is concentrated in the gap. This is because the air permeability in the core is different from the gap.
Magnetostrictive force distribution

Magnetostrictive force distribution dependent on magnetic flux density is shown in Fig. 2.
As magnetostrictive force is larger than electromagnetic force, it needs to be added as a vibratory force, which is not just electromagnetic force alone.
As magnetostrictive force is larger than electromagnetic force, it needs to be added as a vibratory force, which is not just electromagnetic force alone.
Eigenmode

The eigenmode at around 10 kHz is shown in fig. 3. It was learned that the reactor has a mode in which it vibrates horizontally in the vicinity of 100 kHz. A great deal of vibration is likely to be caused by resonance phenomena between this eigenmode and the electromagnetic force.
Acceleration

Fig. 4 shows acceleration distribution. In this analysis data, confirm the results of analysis setting magnetic force only or magnetostrictive force only for the excitation force, and analysis when setting both of them for the excitation force. Looking at Fig. 4 shows that the degree of acceleration generated is greater in magnetostrictive force than in electromagnetic force. Taking both electromagnetic and magnetostrictive force into account with excitation force sees each cancel out the other and vibration reduced.
Sound Pressure Distribution

The distribution of the sound pressure level is shown in fig. 5. In this analysis data, confirm the results of analysis setting magnetic force only or magnetostrictive force only for the excitation force, as well as for analyses when setting both as the excitation force. Looking at Fig. 5 shows that sound pressure is greater in electromagnetic force than in magnetostrictive force as in the acceleration. Taking both electromagnetic and magnetostrictive force into account with excitation force sees each cancel out the other and sound pressure reduced