*Please prepare a license ID and password for the license administrator.
*It is different from the service for JMAG WEB MEMBER (free membership). Please be careful.
Overview
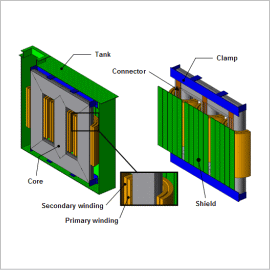
Transformers are made to be used long-term, so it has become an important design policy to control running costs from losses. These losses include copper loss in the coil and iron loss in the core. In high-capacity transformers, however, there is also stray loss in the tank from flux leakage from the core. Stray loss is not only the total loss value, it also poses the risk of generating heat locally so there is a need to check loss distribution.
Predicting these losses and the heat that they generate is a vital component of transformer design, but it is difficult to estimate them from desktop calculations, so evaluations and detailed analyses using the finite element method (FEM) are indispensable.
This note obtains loss distribution for each component in drive condition and checks local overheating.
Joule Loss Density Distribution
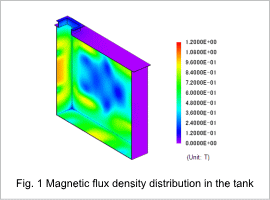
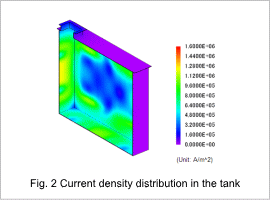
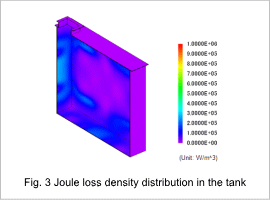
Fig. 1 shows the magnetic flux density distribution, fig. 2 shows the current density distribution, and fig. 3 shows the joule loss density distribution in the tank. From fig. 1, it is apparent that magnetic flux is leaking from the transformer to the tank. This leakage flux generates eddy currents in the tank, as shown in fig. 2. Fig. 3 shows that joule losses get bigger in places with high current density.
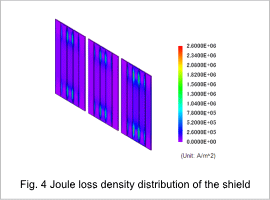
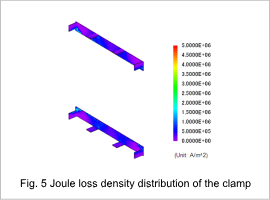
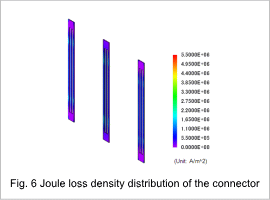
Joule loss distribution or the shield, clamp and connector are displayed in figures 4 through 6 Check the danger of localized heating from joule loss distribution in each part.
Iron Loss Density Distribution
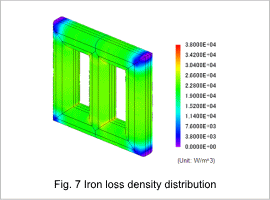
Fig. 7 shows the iron loss density distribution in the core. From fig. 7, it is apparent that iron losses increase in the inside corners. This is caused by the flow of magnet flux concentrating on the shortest path through the magnetic circuit.
Losses
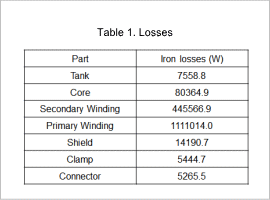
Table 1 shows the losses in each part.


