Overview
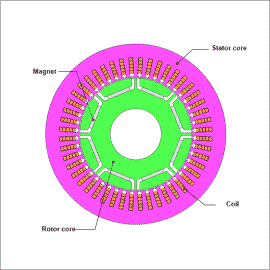
By using the templates included in JMAG-Express, you can create motor models and evaluate design plans both quickly and easily. In addition, by combining the prepared scenarios, you can run magnetic design, thermal design, structural design, and electric field design all at the same time.
In this example, the efficiency, part temperature, stress, and electric breakdown are evaluated at the same time for the motor design plan, and a design plan that meets the requirements is explored.
Design Requirements, Design Variables
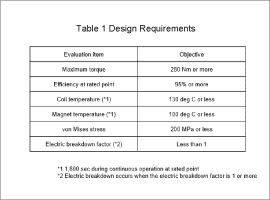
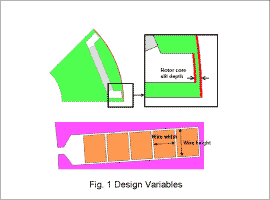
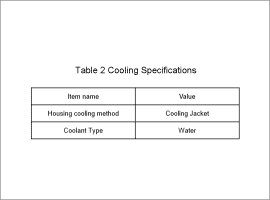
Table 1 shows the design requirements, Fig. 1 shows the rotor core and coil wire geometry that are the design variables, and Table 2 shows the cooling specifications.
The design variables are the rotor core slit depth, wire geometry, and cooling jacket flow velocity.
Initial Design Plan Evaluation
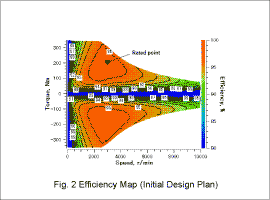
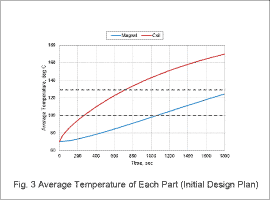
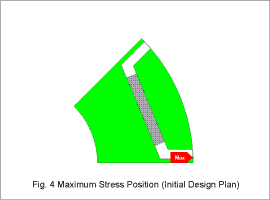
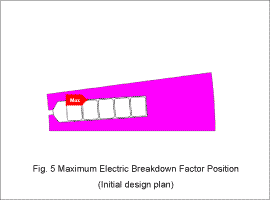
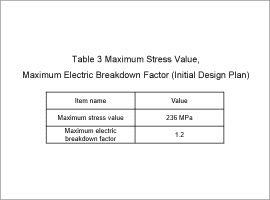
Fig. 2, Fig. 3, Fig. 4, and Fig. 5 show the efficiency map, average temperature of each part, maximum stress position, and maximum electric breakdown factor position, respectively, for a rotor core slit depth of 0.1 mm, a wire width of 3.5 mm, a wire height of 4.5 mm, and a cooling jacket flow velocity of 0.02 m/s. Table 3 shows the maximum stress value and the electric breakdown factor. The stress and electric breakdown factor shown are for a rotation speed of 10,000 r/min and a test voltage of 5,000 V, respectively.
From Fig. 2, it can be seen that the maximum torque exceeds the requirement of 280 Nm and the efficiency at the rated point exceeds the requirement of 95%.
On the contrary, Fig. 3 shows that the coil temperature exceeds 130 deg C, the magnet temperature exceeds 100 deg C, and Fig. 4, Fig. 5, and Table 3 show that the maximum stress occurs at the bridge, where it exceeds 200 MPa, and for the insulation paper, the electric breakdown factor exceeds 1. This indicates that adjustments are necessary in terms of temperature, stress, and the presence of electric breakdown.
Design Plan Adjustments
The design variables are adjusted based on the results of the initial design plan.
In this example, the evaluation is run again with the rotor core slit depth changed to 0.5 mm, the cooling jacket flow velocity changed to 2 m/s, the wire height changed to 4 mm, and the wire width changed to 3.4 mm.
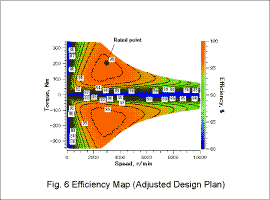
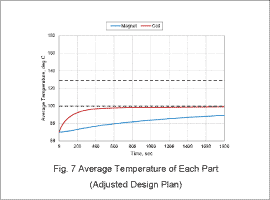
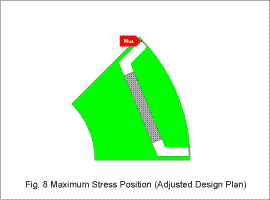
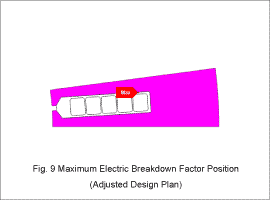
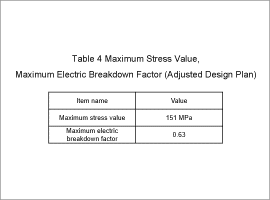
Fig. 6, Fig. 7, Fig. 8, and Fig. 9 show the obtained efficiency map, average temperature of each part, maximum stress position, and maximum electric breakdown factor position, respectively. Table 4 shows the maximum stress value.
From Fig. 6, it can be seen that the maximum torque exceeds the requirement of 280 Nm and the efficiency at the rated point exceeds the requirement of 95%.
Fig. 7 shows that the coil temperature is 130 deg C or less and the magnet temperature is 100 deg C or less. Fig. 8, Fig. 9, and Table 4 show that the maximum stress occurs at the bridge, where it is 200 MPa or less. For the insulation paper where the electric breakdown factor is maximum, the electric breakdown factor is less than 1. This indicates that the design plan meets the requirements after the adjustments have been made.
