Contents
1. Introduction
2. Issues
3. Test motor and measuring system
3.1 Motor
3.2 Control/Inverter
3.3 Measuring system
4. Simulation model
4.1 Magnetic field analysis model
4.2 Control and inverter
4.3 Calculation method
5. Efficiency map comparison
5.1 Efficiency map
5.2 Contribution of loss generating factors to efficiency map
5.2.1 Harmonic iron loss by PWM carrier
5.2.2 Copper AC loss
5.2.3 Stress
5.2.4 Processing strain
5.2.5 Surface eddy current loss
5.2.6 Minor loop
5.2.7 Magnet eddy current loss
6. Required loss analysis accuracy and loss component for each operating point
7. Summary
8. Reference
1. Introduction
High efficiency is required for traction motors on a wide range of operation, from low-speeds to high-speed and low loads to high loads. Requiring, a highly accurate model in a wide range of operating regions.
In this paper, an efficiency map obtained using simulation and one based on actual measurement are compared. The contribution of each loss components is evaluated. Highlighting the importance to consider the effect of harmonic iron loss by PWM carrier, AC copper loss and iron loss increase due to stress, in the modeling of the machine.
2. Issues
In the development and design of high-efficiency motors such as those used for automobile drives, high accuracy is required in order to enable verification and performance evaluation via simulation. The aim being, to eliminate the need for prototyping. For example, 1% efficiency error is not negligible in regions where the efficiency exceeds 90%. The accuracy of the efficiency calculation depends on the output, in other words, the torque and losses. For example, in order to estimate the efficiency error within 1% for a motor with an efficiency of 90%, the error of the loss should be within 11%.
Generally, the simulation is carried out in the ideal state without manufacturing effect and assuming the two-dimensional model for reasons such as calculation cost. As a result, there is a significant difference from the measured efficiency map. It is because the loss components which influence the efficiency of the motor are not sufficiently considered. For example, the effect of time harmonics (hereinafter carrier harmonics) due to the PWM inverter driving the motor, the eddy current loss (hereinafter AC copper loss) in the hairpin coil often adopted in the vehicle driving motor in recent years. In addition, stress and processing strain applied when manufacturing the core of the motor with electrical steel sheets increase the material’s losses in the actual machine (so-called building factor).
The accuracy actually required for the efficiency calculation depends on the motor and the evaluation operating point. The above loss modeling also has different contribution depending on the operating point. Therefore, this paper explains the modeling necessary for obtaining a global accuracy of 1% error through the comparison of a measurement efficiency map of an actual machine, with its associated simulation model.
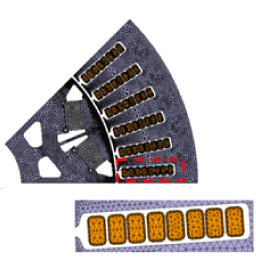
(a) 2D analysis model
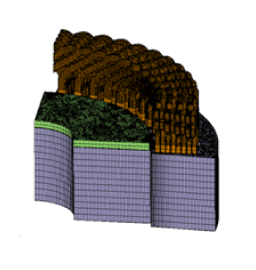
(b) 3D analysis model
Mesh models
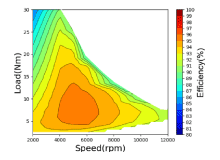
(a) Simulation
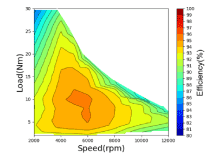
(b) Actual measurement
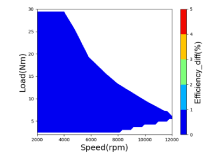
(c) Efficiency difference (%)
Comparison of efficiency maps
You need to sign in as a Regular JMAG Software User (paid user) or JMAG WEB MEMBER (free membership).
By registering as a JMAG WEB MEMBER, you can browse technical materials and other member-only contents for free.
If you are not registered, click the “Create an Account” button.
Create an Account Sign in


