Overview
What is required for a motor, which is the key component in vehicle electrification, is not only high performance as a component but also high consistency with the system.
Model-based development using simulation is also becoming indispensable for motor development.
JMAG, which has a high track record in motor design, proposes a new workflow for model-based development.
How the development of motors for EVs will proceed in system design, component design, prototype / performance evaluation, and system verification is presented.
All the examples shown are from simulations using JMAG.
About the motor development workflow
In this case study, the motor development workflow assumed for EVs is divided into four phases and described in the following four panels: system design, component design, prototype/performance evaluation, and system verification.
The four phases present one V-shaped development workflow. However, presented here is not an already existing workflow, but rather a workflow for model-based development based on simulations.
Motor Development Workflow
1. System Design
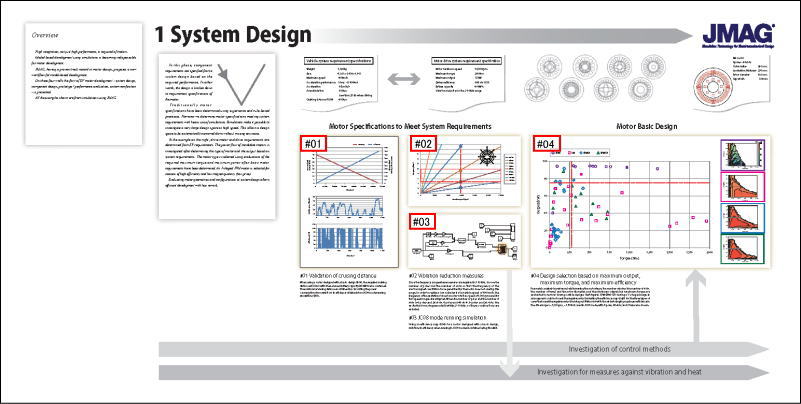
The specifications of the motor are determined while confirming that the system requirements are met with heavy use of simulations, where previously motor specifications were determined using experience and rule-based processes. By simulation it is possible to investigate a very large design space at high speed, so it is possible to narrow down the design space more systematically without missing any cases while leaving freedom for a later process.
In system design, from EV requirements, drive motor and drive requirements are deduced. First, after identifying the type of motor and the output based on system requirements, the power flow of candidate motors is examined; and after basic motor requirements are determined, motor type selection is carried out from evaluations of required maximum torque and maximum power. An I-shaped IPM motor is selected for reasons of high efficiency and low magnet quantity (low price).
By examining specific motor geometries and configurations at system design, it is possible to develop efficiently with less rework.
#01 Verification of cruising distance
System design begins with vehicle system requirements. Given vehicle system requirements the requirements of the motor drive, battery, control, cooling, and drive system subsystem are determined. In this case study the requirements are: weight – 1,300 kg, size – 4,300 x 1,800 x 1,600, maximum speed – 160 km/h, acceleration performance – 0-100 km/h in 10 seconds, acceleration – 10 km/h/s, noise no greater than 55 dB at a cruising speed of 100 km/h. When vehicle weight and maximum speed are chosen, the maximum speed, maximum output, and maximum torque of the motor can be estimated. However, at this point it is not known whether the motor drive specifications meet the vehicle system requirements. Because of this, basic motor design is carried out, and whether the cruising distance, one of the requirements, is met or not is verified. For this, basic design information is required for batteries and drive systems as well.
Fig. 1-1 shows the maximum cruising distance for the electrical power consumption calculated from the variation in efficiency obtained from JC08 mode running simulation. Using the basic designed motor, whether the required cruising distance (400 km) with the assumed battery capacity (40 kWh) can be obtained is confirmed.
In the running simulation, the JC08 vehicle speed history in Fig. 1-2 is input and the variation in efficiency in Fig. 1-3 is obtained. This verification is carried out in the course of breaking down the vehicle system requirement specifications to the requirement specifications of subsystems such as the motor drive system. At this stage, the motor information to be input are requirement specifications (maximum output, maximum torque, and efficiency).
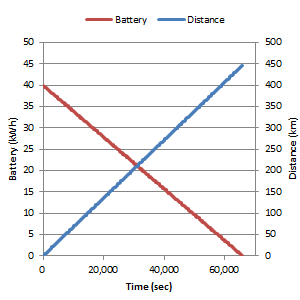 Fig. 1-1 Cruising distance and battery power consumption history
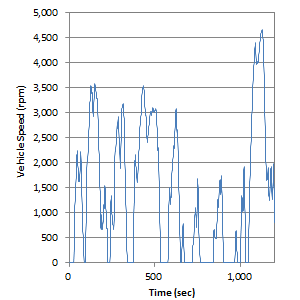 Fig.1-2 JC08 mode vehicle speed history
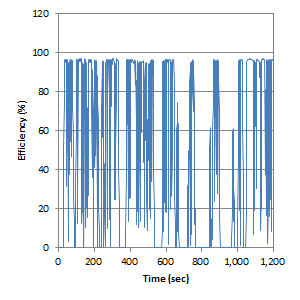 Fig.1-3 Motor efficiency during JC08 running mode
If the cruising distance requirement is not met at this stage, then the subsystem requirement specifications are insufficient. Therefore in this case, the subsystem requirements are be redetermined.
At this point, an efficiency map is generated from the requirement specifications of the motor drive system using JMAG-Express and JMAG-RT Viewer and verified by running simulation.
For #02 – #04, please check the PDF version
Sign in to read PDF version
2. Component Design
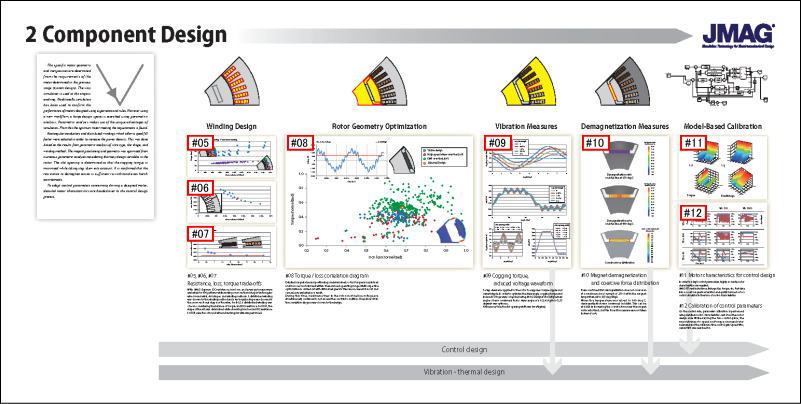
Traditionally, simulation has been used to confirm the performance of motors designed using experience and rules, but with the new workflow, from parametric analysis that makes use of the characteristics of simulation a large design space is searched and the optimum motor meeting the requirements is found.
In this case study rectangular conductors and distributed windings which allow a good fill factor were selected in order to increase the power density. This was done based on the results of parametric analysis for wire type, slot shape, and winding method. Since the rotor has many design variables, from numerous parametric analyses the magnet positioning and geometry was optimized. Taking step skew into account, slot opening width is determined such that cogging torque is minimized. Finally, it is confirmed that the demagnetization resistance is sufficient to withstand even harsh environments.
To adapt control parameters concerning driving a designed motor, detailed motor characteristics are handed over to the control design process.
#05 Resistance
Fig. 5-1 shows the relationship between phase resistance and torque. Distributed winding results and concentrated winding results are shown. It can be seen that for the concentrated winding the resistance value can be lower than for the distributed winding (6-slot pitch, full-pitch winding). However, when looking at the torque, it can be seen that the distributed winding is advantageous. From these results, a distributed winding was adopted to obtain the necessary torque.
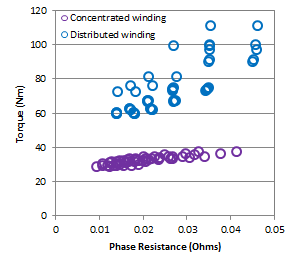 Fig. 5-1 Tradeoffs between winding methods, torque and resistance
For #06 - #12, please check the PDF version
Sign in to read PDF version
3. Prototyping and Tests
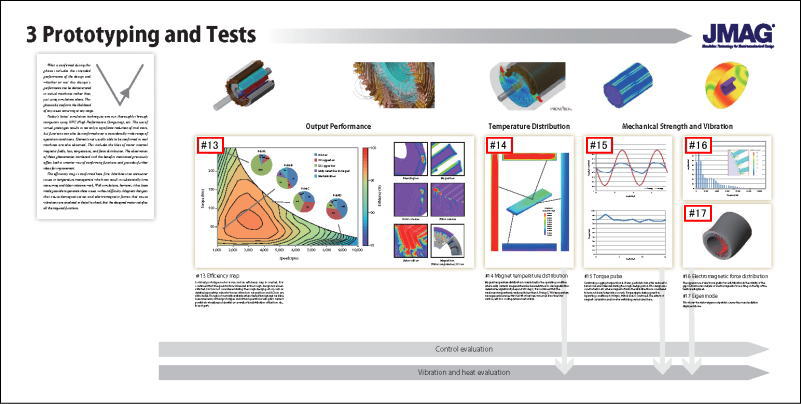
Today's latest simulation techniques are run thoroughly through computers using the likes of HPC (High Performance Computing).
Using virtual prototypes results in not only a significant reduction of trial costs, but functions can also be confirmed over a considerably wide range of operation conditions. Elements not usually able to be confirmed in real machines are also observed, such as motor internal magnetic fields, loss, temperature, and force distribution. This offers both a smarter way of confirming functions as well as further ideas for improvement.
The efficiency map is confirmed here first. Machines can encounter issues in temperature management which can result in substantially time consuming and labor intensive work, but simulations make it possible to generate these issues without difficulty. Magnetic hotspots that cause demagnetization and electromagnetic forces that cause vibrations are analyzed in detail to check that the designed motor satisfies all the required functions.
#13 Efficiency map
Fig. 13-1 shows an efficiency map made by obtaining loss from repeated calculations of FEA that use the current waveform as input. The current waveform is from the actual run time that accounts for control and the circuit at each operating point. Iron loss is calculated as post processing. Eddy current of magnet and coil are calculated. Each time the efficiency map is evaluated during basic design stages, sinusoidal current is assumed and the effect of the eddy current is not accounted for. Fig. 13-1 additionally displays a classification of loss at 4 representative operating points. Copper loss is the highest at point A because due to high load at a large flowing electrical current. Point B maintains a large proportion of iron loss because the PWM carrier frequency component is largely included at a low speed and a low load. It is understood that at Point C and Point D, rotation speed increases and AC loss grows larger. Fig. 13-2(a)-(f) displays the loss density distribution of each part. Stray load loss that is generated in detailed parts such as the press ring is also evaluated here.
Eddy currents are primarily due to magnetic flux leaking from the core surface of the press ring, rotor, stator surface, and coil end parts. Loss is generated whenever magnetic flux has an axial component in the air gap. Fig. 13-2(f) displays the relationship between flux the frequency component and loss density. The carrier frequency component flux line and loss density distribution are shown in the stator core and the magnet part. Virtual prototypes make it possible to both visualize and analyze the main causes of loss generations.
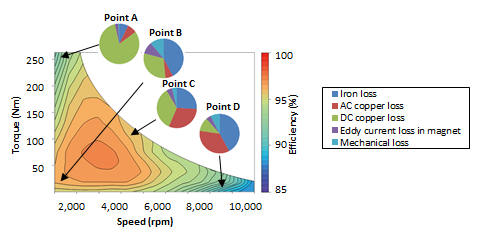 Fig. 13-1 Efficiency map during prototype and verification stages
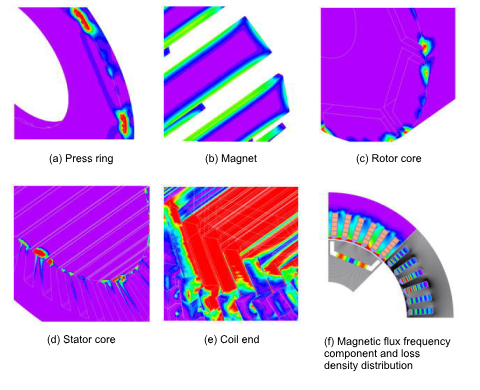 Fig. 13-2 Loss density distribution at each part
For #14 - #17, please check the PDF version
Sign in to read PDF version
4. System Verification
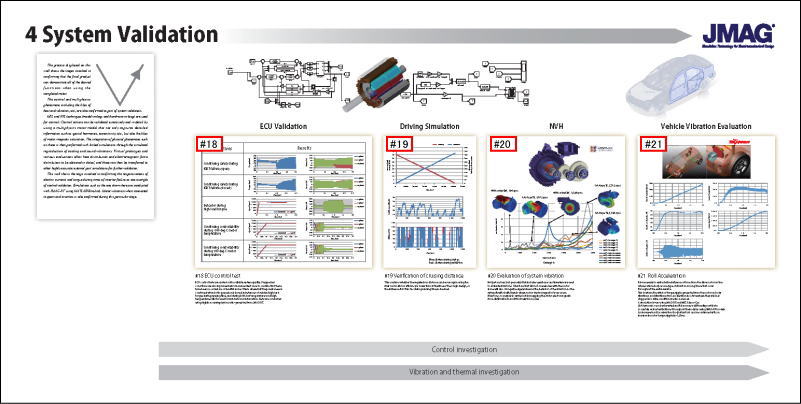
The control and multiphysics phenomena such as heat and vibration, etc., are confirmed as part of system validation.
MIL/HIL techniques are used for control. Control actions can be validated extensively and in detail using a highly accurate motor model that also captures detailed information such as spatial harmonics, eccentricity, etc., as well as motor magnetic saturation. The integration of physical phenomenon is performed with linked simulations through cooling and sound vibrations. Virtual prototypes and evaluations obtain detailed heat distribution and electromagnetic force distribution which can be transferred to other external 3rd party tools for highly accurate validations.
The corresponding shows the confirmation of electric current and torque responsiveness during times of inverter failure as one example of control validation. This simulation is conducted with JMAG-RT using MATLAB/Simulink. Motor vibration when connected to gears and inverters is also confirmed.
#18 ECU control test
Fig. 18 display typical test items and test results where JMAG-RT and Simulink are used, confirming that there is no current overflow due to simulated IGBT failure when either permanently opened or closed. Testing during real machine failure is both dangerous and comes at an additional cost, but Model-Based Development make safe and effective tests entirely possible. Motor behaviour each time a high torque of 170Nm is applied during run time is the next item to be confirmed. The inverter maximum current (250A) does not cause conflict even with a load of 170Nm for a single second, and it was confirmed that speed quickly returned to the command value. The command value could be followed without delays even when changing the temperature. This confirmed that no problems had occurred.
A plant model generated from JMAG-RT is used here for simulations. For JMAG-RT models to reproduce magnetic saturation and spatial harmonics in detail, motor behaviour is recreated equal to that of a real machine. This includes recreating unstable drive conditions. JMAG-RT models can additionally use various HILs as-is.
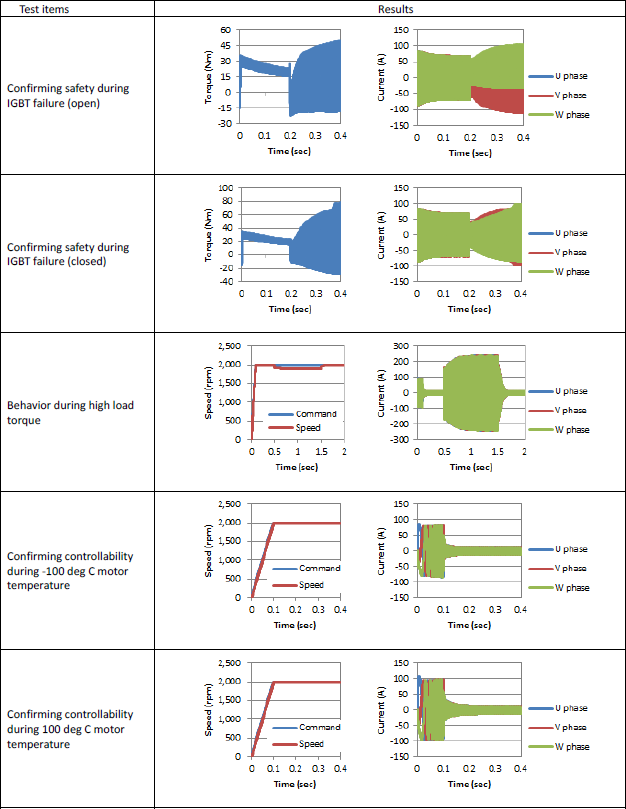 Fig. 18 Typical test items and test results for ECU control
For #19 - #21, please check the PDF version
Sign in to read PDF version
Related materials
- [L-OP-03] Multi-Objective Optimization with JMAG
- [L-MU-07]Multiphysics Analysis by Linking with Specialized Tools
- [W-MO-23] Measurement of PM Motor Vibration/Noise and Analysis Modeling
- [L-OP-25] Utilizing JMAG in Cloud Services
- [L-OP-26] Reducing License Costs for Multi-Case Calculations
- [L-HU-43] Notes on Performance Evaluation and Hardware Selection of JMAG Parallel Solver
- [L-MB-55] High Fidelity Behavior Models Generation for Control/Circuit Simulation using JMAG-RT
- [W-MA-70] Mesh Modeling for Coil AC Loss Analysis
- [L-MO-77] Motor Concept Design with JMAG-Express and JMAG-RT Viewer
- [L-OP-78]User-Defined Geometry Library
- [L-MB-79] Accounting for Circuit Coupling Functions with Control Systems
- [L-SE-81] Mesh Verifications at Higher Speeds
- [L-MB-82]FEA Models to Plant Models within Short Time Periods
- [W-MO-85] Efficiency Map Evaluations Considering Harmonic Loss
- [W-MA-88] Improvements in Accuracy of Anomalous Eddy Current Loss Calculations
- [L-MO-89]JMAG-Express Motor Design Tool
- [L-MO-90] Detailed Coil Modelling for Motors
- [L-MU-91] NVH analysis of EV drivelines with JMAG and Romax Nexus
- [L-MU-92] JMAG/Particleworks Coupled Motor Cooling Analysis
- [L-MU-93] JMAG/Adams/Simulink Coupled Vehicle Drive Simulation
You need to sign in as a Regular JMAG Software User (paid user) or JMAG WEB MEMBER (free membership).
By registering as a JMAG WEB MEMBER, you can browse technical materials and other member-only contents for free.
If you are not registered, click the “Create an Account” button.
Create an Account Sign in